Figures & data
Figure 1 High-AGE diets induce insulin resistance and increase intestinal permeability in mice. (A) Changes in body weight among the control and dietary and exogenous AGE groups during the 24-week feeding period. (B) Changes in serum fasting blood glucose levels among the three groups at baseline and weeks 12 and 24. (C) Fasting insulin levels among the three groups at week 24. (D) Homeostatic model assessment insulin resistance (HOMA-IR) among the three groups at week 24. (E) Glucose tolerance was assessed by the intraperitoneal glucose-tolerance test (IPGTT) in the three groups at week 24. (F) Glucose area under the curve (AUC) during IPGTT. (G) Serum AGE levels among the three groups at week 24. (H) Serum lipopolysaccharide-binding protein (LBP) levels among the three groups at week 24. *p < 0.05, **p < 0.01, and ***p < 0.001 for intergroup comparisons; #p < 0.05 and ##p < 0.01 for comparison with the control group at the same time point.
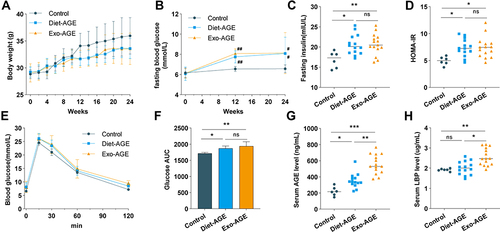
Figure 2 High-AGE diets alter gut microbiota structure and composition in mice. (A) Evaluation of α-diversity according to Observed species. (B) Evaluation of α-diversity according to Simpson’s diversity index. (C) Evaluation of β-diversity via principal coordinate analysis (PCoA) based on weighted UniFrac distance. (D) Key operational taxonomic units (OTUs) were clustered into six co-abundance group (CAGs) using weighted correlation network analysis (WGCNA), labeled by various colors. (E) Time-course changes in the abundance of gut bacteria at the family level among the three groups. Circle size and color indicate the relative abundance and phylum level of gut bacteria, respectively. The heatmap in the right panel was generated based on p-values. The Wilcoxon rank-sum test was used to compare two groups at the same time point. *p < 0.05; **p < 0.01 for intergroup comparisons.
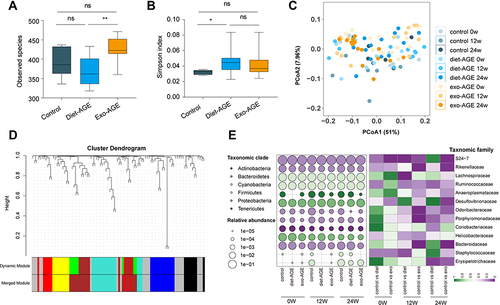
Figure 3 Changes among the six co-abundance groups (CAGs) in the gut microbiota of mice fed high-AGE diets for 24 weeks. Different node colors and shapes represent different CAGs and phyla, respectively. Round, square, triangle, diamond, hexagon, and octagon represent Bacteroidetes, Firmicutes, Proteobacteria, Actinobacteria, Tenericutes, and Cyanobacteria, respectively. The relative abundance of each CAG was summed from the relative abundance of the included operational taxonomic units (OTUs) in all samples of each group. *p < 0.05; **p < 0.01; ***p < 0.001 for comparison with the control group at the same time point.
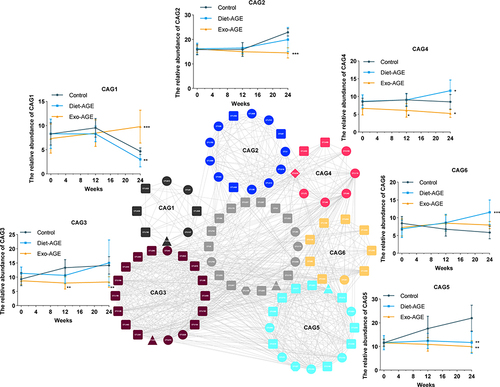
Figure 4 Correlation analysis between co-abundance groups (CAGs) and clinical phenotype in the three groups. (A) Receiver operating characteristic (ROC) curves were applied to assess the ability of the six CAGs to discriminate between the high-AGE diet and control groups. (B) Heatmap of correlations between CAGs and clinical phenotype in the three groups. The color represents the level of correlation: red, positive correlation; blue, negative correlation. *p < 0.05; **p < 0.01.
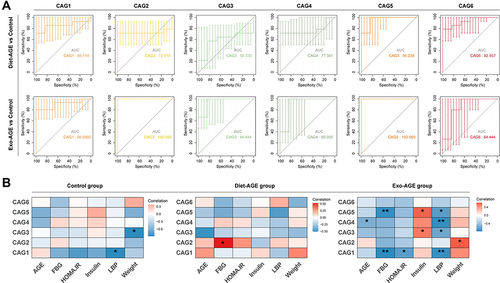
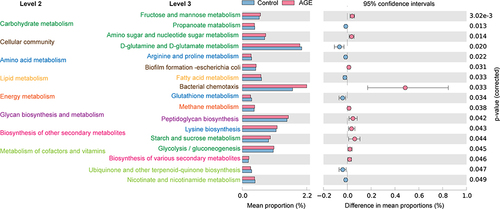
Figure 5 Functional changes in gut microbiota, as predicted by Kyoto Encyclopedia of Genes and Genomes (KEGG) pathway analysis. Hierarchical clusters of metabolic pathways are denoted with different colors.