
Figures & data
Table 1 Prevalence, Type, and Severity of DR Among Diabetic Patients Attending the DM Clinic of Siriraj Hospital
Figure 1 Prevalence of diabetic retinopathy stratified according to age group (A) and duration of diabetes (B).
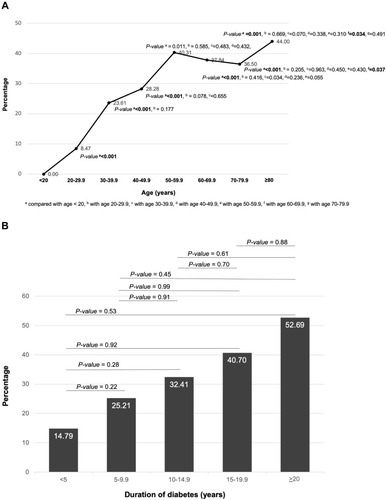
Figure 2 Prevalence of diabetic retinopathy in different types of diabetes stratified according to duration of diabetes (A) and severity of diabetic retinopathy (B).
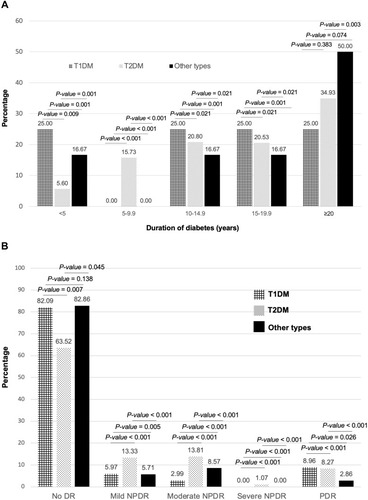
Table 2 Demographic and Clinical Characteristics of Diabetic Patients Compared Between Those with and without DR
Table 3 Demographic and Clinical Characteristics of Diabetic Patients Compared Between Those with No DR and Those with NPDR, and Between Those with No DR and Those with PDR
Table 4 Metabolic and Blood Pressure Control Compared Between Those with No DR and Those with DR, Between Those with No DR and Those with NPDR, and Between Those with No DR and Those with PDR
Table 5 Univariate Analysis for Factors Significantly Associated with DR in Patients with Diabetes
Table 6 Multivariate Analysis for Factors Independently Associated with DR in Patients with Diabetes
Table 7 Medications Used Among Diabetic Patients Compared Between Those with and without DR