Figures & data
Figure 1 AS-IV improves STZ-induced INS-1 cell viability. (A) The chemical structure of astragaloside IV. (B and C) Cell viability was detected by Cell Counting Kit-8 assay. The normal INS-1 cells without STZ and AS-IV treatment were served as control. ***P<0.001 vs control; #P<0.05, ##P<0.01 vs STZ+ AS-IV.
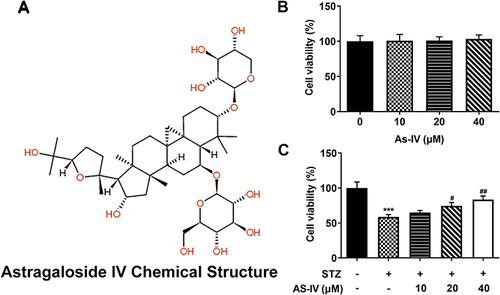
Figure 2 AS-IV inhibits STZ-induced apoptosis of INS-1 cells. (A) Cell apoptosis was evaluated using a TUNEL assay and (B) quantified. (C) Expression levels of apoptosis-related proteins, Bcl-2, Bax, cleaved caspase 3 and caspase 3 were determined using Western blotting and semi-quantified. β-actin was served as loading control. The normal INS-1 cells without STZ and AS-IV treatment were served as control. ***P<0.001 vs control; #P<0.05, ##P<0.01, ###P<0.001 vs STZ+ AS-IV.
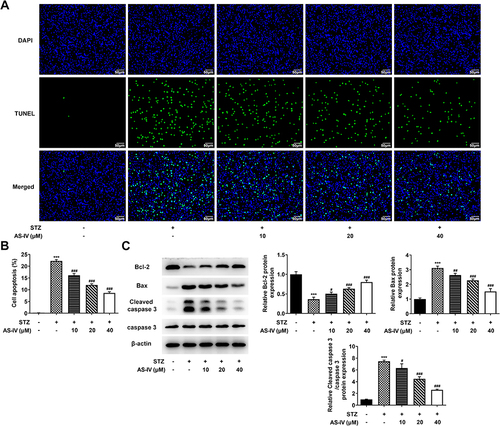
Figure 3 AS-IV reduces STZ-induced oxidative stress in INS-1 cells. (A) Lipid peroxidation, (B) superoxide dismutase activity and (C) GSH/GSSG Ratio were determined using corresponding kit. The normal INS-1 cells without STZ and AS-IV treatment were served as control. ***P<0.001 vs control; #P<0.05, ##P<0.01, ###P<0.001 vs STZ+ AS-IV.
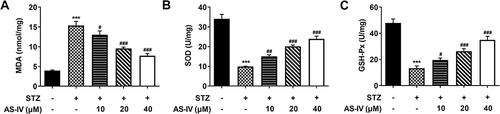
Figure 4 AS-IV improves STZ-induced insulin secretion in INS-1 cells. (A) The levels of insulin secretion were detected using the corresponding ELISA kit. Relative mRNA levels of (B) insulin 1 and (C) insulin 2 were determined via RT-qPCR. The normal INS-1 cells without STZ and AS-IV treatment were served as control. ***P<0.001 vs control; #P<0.05, ##P<0.01, ###P<0.001 vs STZ+ AS-IV.
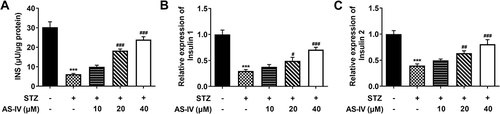
Figure 5 AS-IV regulates SIRT1/p53 and Akt/GSK3β/Nrf2 signaling pathways. Expression levels of pathway-related proteins, SIRT1, p53, p-Akt, Akt, p-GSK3β, GSK3β and Nrf2, were determined using Western blotting and semi-quantified. β-actin was served as loading control. The normal INS-1 cells without STZ and AS-IV treatment were served as Control. ***P<0.001 vs control; ##P<0.01, ###P<0.001 vs STZ+ AS-IV.
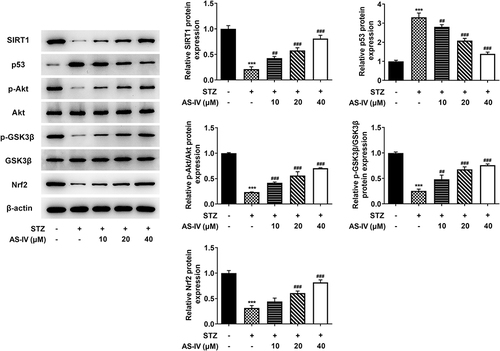
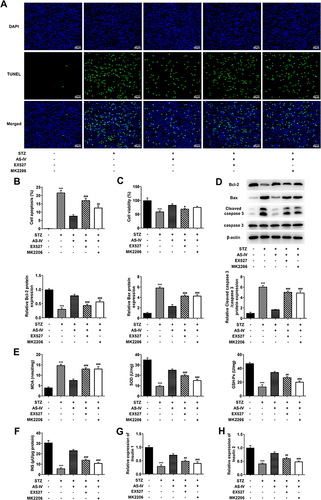
Figure 6 EX527 (SIRT1 inhibitor) or MK2206 (Akt inhibitor) reversed the protective effect of AS-IV on STZ-induced INS-1 cells. (A) Cell apoptosis was evaluated using a TUNEL assay and (B) quantified. (C) Cell viability was detected by Cell Counting Kit-8 assay. (D) Expression levels of apoptosis-related proteins, Bcl-2, Bax, cleaved caspase 3 and caspase 3 were determined using Western blotting and semi-quantified. β-actin was served as loading control. (E) Lipid peroxidation, superoxide dismutase activity and GSH/GSSG ratio were determined using corresponding kit. (F) The levels of insulin secretion were detected using the corresponding ELISA kit, and the relative mRNA levels of (G) insulin 1 and (H) insulin 2 were determined via RT-qPCR. The normal INS-1 cells without STZ, AS-IV, EX527 and MK2206 treatment were served as Control. ***P<0.001 vs Control; #P<0.05, ##P<0.01, ###P<0.001 vs STZ+ AS-IV+.