
Figures & data
Figure 1 CONSORT diagram to show the recruitment process of participants.
Note: Adapted from Schulz KF, Altman DG, Moher D, for the CONSORT Group. CONSORT 2010 Statement: updated guidelines for reporting parallel group randomised trials. Br Med J. 2010;340:c332. doi: 10.1136/bmj.c332. Creative Commons.Citation48
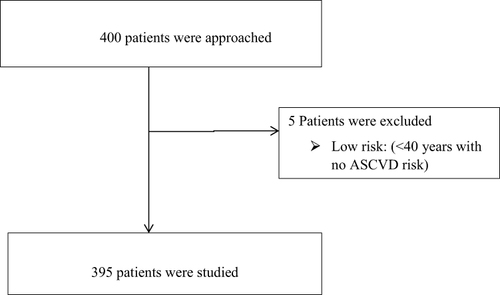
Table 1 Sociodemographic and Clinical Characteristics of type 2 Diabetes Participants (n = 395)
Figure 2 Prescribed statins among study participants.
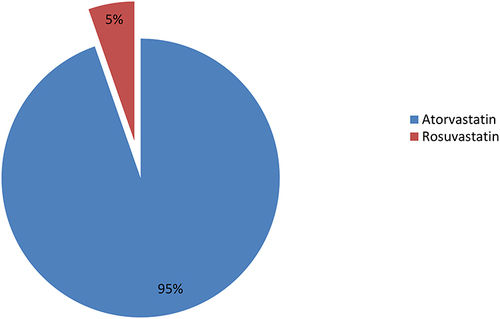
Figure 3 Prescription of statins in relation to risk stratification among type 2 diabetes participants.
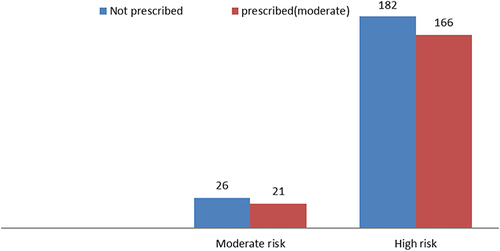
Table 2 Factors Associated with Statin Prescription Patterns Among Type 2 Diabetes Participants (N = 395)
Table 3 Multivariate Logistic Regression on Factors Associated with Statin Prescription Patterns