Figures & data
Table 1 Demographic and Clinical Characteristics of All Patients at Baseline
Figure 1 The relative abundance of gut microbiota in two groups. (A) The relative abundance of top 10 microbial taxa at the phylum level. (B) The relative abundance of top 20 microbial taxa at the genus level. Each bar represents a bacterial taxon and the length of the bar indicates the abundance level.
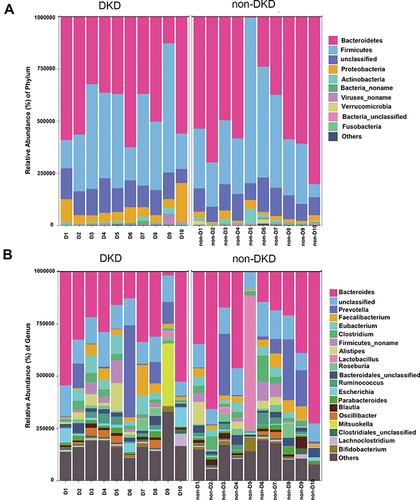
Figure 2 The score plot of the PLS-DA model between the DKD and non-DKD groups. Red cycle: DKD group; blue triangle: non-DKD group.
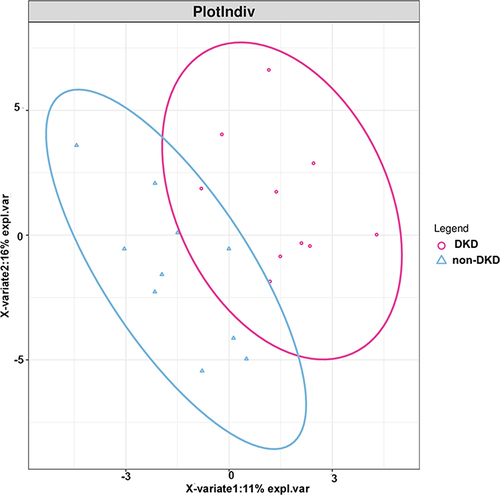
Figure 3 The LDA scores of differentially abundant microbiota at genus and species levels between the DKD and non-DKD groups.
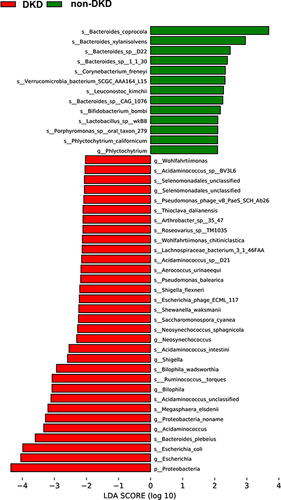
Figure 4 The correlations between gut microbiota and clinical characteristics. The color gradient indicates p-value; red: positive correlation; blue: negative correlation.
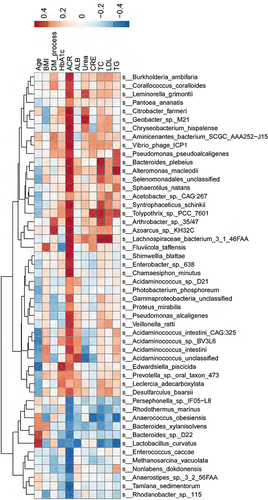
Figure 5 The KEGG enrichment analysis of gut microbiota in the DKD and non-DKD groups. The smaller the p-value, the higher the degree of enrichment.
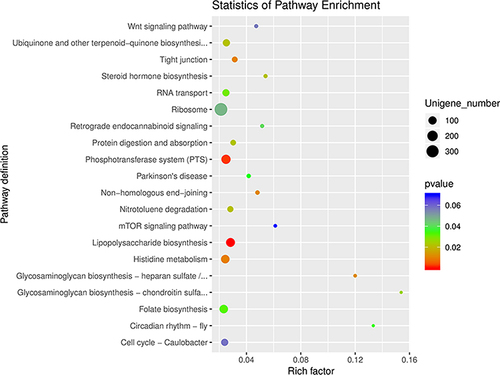
Figure 6 The abundance of carbohydrate-active enzymes (CAZymes) in the gut microbiota of the DKD and non-DKD groups.