
Figures & data
Table 1 Baseline Clinical and Biochemical Characteristics of the Studied Population
Table 2 The Association of rs266729 with T2DM
Table 3 The Association of rs3774261 with MetS
Table 4 The Association of rs266729 with MetS
Table 5 The Association of Haplotype rs266729/rs822393 with MetS
Figure 1 Linkage disequilibrium between allele pairs of rs266729, rs1501299, rs3774261, and rs822393.
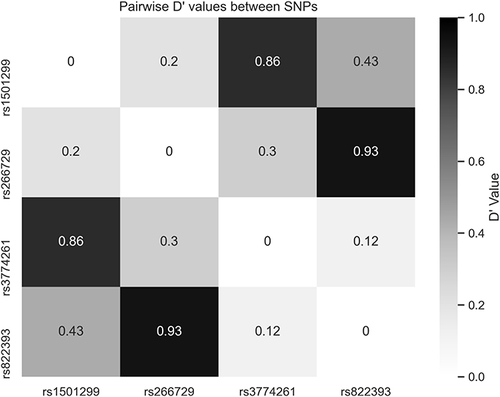
Table 6 The Association of rs266729 with Clinical and Biochemical Characteristics in T2DM and Control Subjects
Table 7 The Association of rs3774261 with Clinical and Biochemical Characteristics in MetS and Control Subjects