
Figures & data
Figure 1 The KDIGO risk categories.
Notes: Green, low risk; yellow, moderate risk; orange, high risk; red, very high risk.
Abbreviations: ACR, albumin/creatinine ratio; eGFR, estimated glomerular filtration rate; KDIGO, Kidney Disease: Improving Global Outcomes.
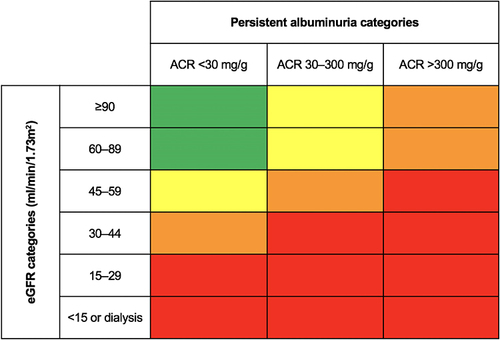
Table 1 The Clinical Characteristics of Study Subjects with or without DKD
Figure 2 The prevalence of thyroid dysfunction in subjects with or without DKD.
Notes: A, B, C and D represent the prevalence of hyperthyroidism, subclinical hyperthyroidism, hypothyroidism, and subclinical hypothyroidism respectively.
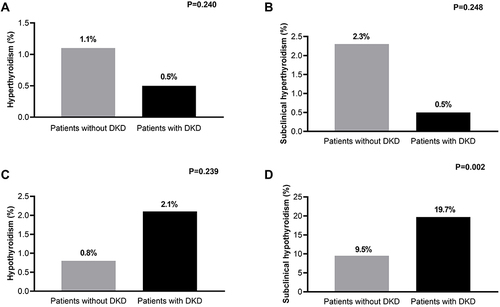
Table 2 Thyroid Hormone Levels in Different ACR, eGFR and KDIGO Risk Categories
Table 3 Correlation Between Thyroid Hormones and Parameters of Renal Function
Table 4 Logistic Regression Analysis of Thyroid Hormones and the Risk of Having Diabetic Nephropathy
Table 5 Logistic Regression Analysis of Thyroid Hormones and the Risk of Diabetic Nephropathy Progression
Table 6 Subgroup Analysis of FT3 and Risk of DKD Progression Stratified by Male and Female