
Figures & data

Figure 1 Analysis of the CRE.(A) LC-MS analysis of Cyperus rotundus extract (CRE) enriched with Piceatannol, Scirpusin A and Scirpusin B, (B) Structures of Piceatannol, Scirpusin A, and Scirpusin B.
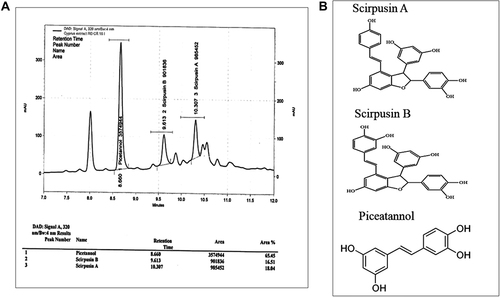
Table 1 Demographics of Subjects in the Pilot Clinical Study
Figure 2 CONSORT flow diagram of subject disposition.Eligible subjects (n = 30) were randomized into Cyperus rotundus extract (CRE) or placebo groups. By considering Last Observation Carry Forward (intent to treat analysis), 27 subjects’ data were considered for efficacy analysis. Whereas for safety analysis, 26 subjects’ data were considered.
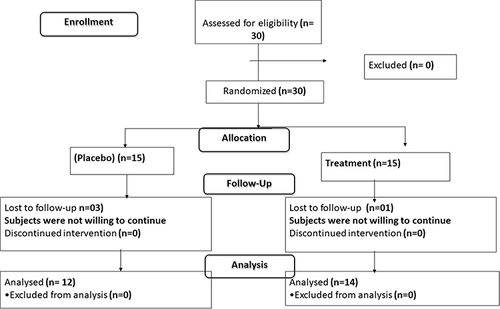
Table 2 Effect on Body Weight and Related Parameters
Figure 3 Effect on body weight Efficacy of Cyperus rotundus extracts (CRE) in overweight subjects observed at five visits from Day 0 to day 90 compared to placebo. a) Bodyweight (Kg), b) BMI (kg/m2), and c) Waist circumference (cm). Values are represented as mean ± SE. **p < 0.01 significant difference between CRE and placebo groups on days 60 and 90.
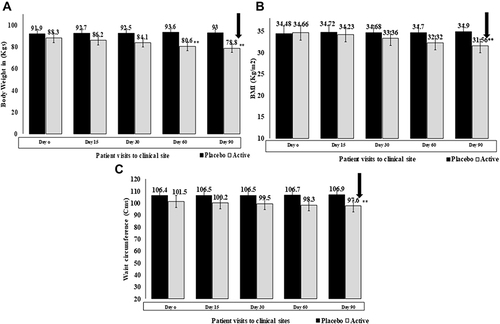
Table 3 Effect on Lipid Levels
Figure 4 Anti-Adipogenesis Activity of CRE in vitro Adipogenesis inhibitory assay in 3T3-L1 mouse adipocytes. (A) Percentage inhibition of adipogenesis activity, (B) neutral triglycerides and lipids in control and treated cells stained by oil red O (ORO) (Black arrow marks), (C) fold change in the transcripts of PPARγ and aP2 genes in CRE (25 μg/mL) compared to untreated differentiated adipocytes.
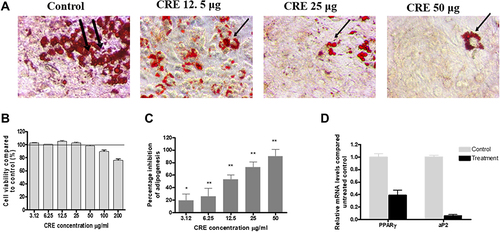
Figure 5 Anti-obesity effect of CRE in High-fat diet-induced obese mice Anti-obesity effect of CRE (50, 100 and 200 mg/kg BW) in HFD-induced obesity in the C57 mice model. (A) Mean change in the body weight (g), (B) mean change in the feed consumption (g), (C) trend of mean change in body weight observed in control and treated groups from day 28 to day 55, (D) corticosterone concentration. (pg/mL), and (E) leptin concentration (pg/mL) in the high-fat diet (HFD) and CRE treated groups. Values are expressed as means ± SEM (n = 6).
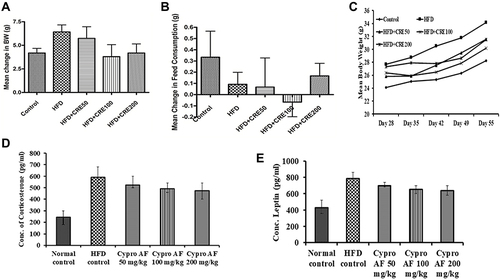
Table 4 Effect of CRE Lipid, and Liver Enzymes, in C57 Mice