
Figures & data
Figure 1 Characteristics of the obese and the control mice. (A), weight; (B), Lee’s index and (C), routine serum lipids. Obese mice, n = 5 and control mice, n = 5. *p < 0.05, **p < 0.01 and ***p < 0.001 when compared between the obese and control mice.
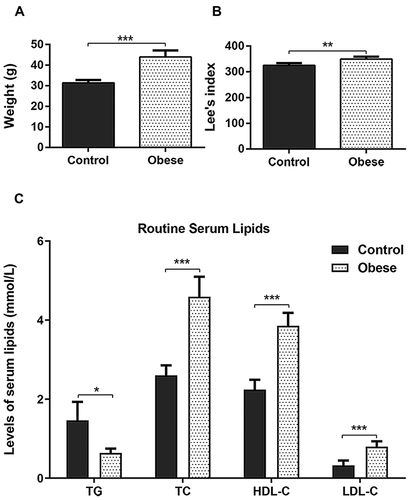
Figure 2 Serum levels of FFAs in obese and control mice. (A), SFAs; (B), MUFAs; (C), PUFAs; (D), FFAs by saturation groups. Obese mice, n = 5 and control mice, n = 5. *p < 0.05, **p < 0.01 and ***p < 0.001 when compared between the obese and control mice.
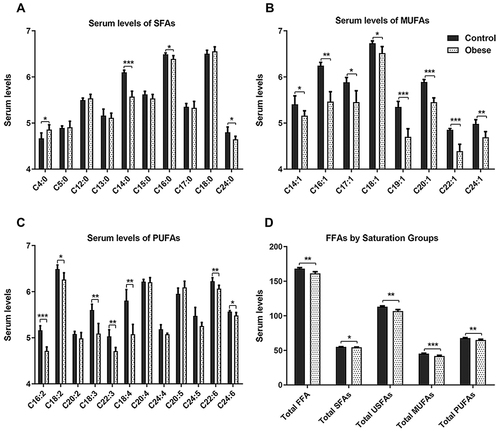
Figure 3 The relative levels of FFAs of the obese and control mice. (A), relative levels of SFAs to total FFAs; (B), relative levels of MUFAs to total FFAs; (C), relative levels of PUFAs to total FFAs; (D), relative levels of SFAs to total SFAs; (E), relative levels of MUFAs to total SFAs; (F), relative levels of PUFAs to total SFAs; (G), relative levels of SFAs to total MUFAs; (H), relative levels of MUFAs to total MUFAs; (I), relative levels of PUFAs to total MUFAs; (J), relative levels of SFAs to total PUFAs; (K), relative levels of MUFAs to total PUFAs and (L), relative levels of PUFAs to total PUFAs. Obese mice, n = 5 and control mice, n = 5. *p < 0.05, **p < 0.01 and ***p < 0.001 when compared between the obese and control mice.
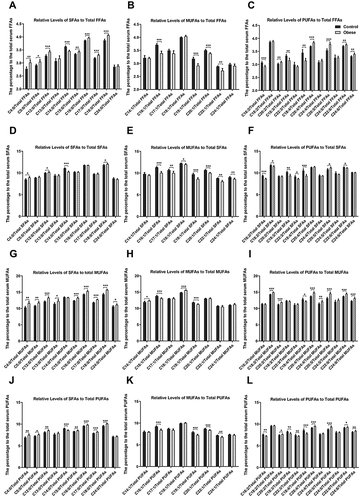
Figure 4 Indices by serum FFAs in the obese and the control mice. Obese mice, n = 5 and control mice, n = 5. *p < 0.05, **p < 0.01 and ***p < 0.001 when compared between the obese and control mice. SCD1-16 and SCD1-18, the indices of stearoyl-CoA desaturase 1 activities evaluated by the ratio of C16:1/C16:0 and C18:1/C18:0, respectively; Elongase, the index of elongase activities evaluated by the ratio of C18:1/C16:1; DNL, the index of de novo lipogenesis evaluated by the ratio of C16:0/C18:2; D6D-1and D6D-2, the indices of δ-6 desaturase activities evaluated by the ratio of C18:3/C18:2 and C18:4/C18:3, respectively.
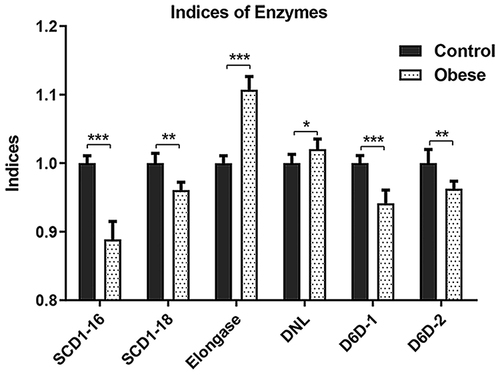
Table 1 Relationships of Serum FFA Levels with the Concentrations of Routine Serum Lipids in the Obese and Control Mice