
Figures & data
Table 1 Characteristics of Patients with and without NAFLD Included in This Study
Table 2 Characteristics of Patients with and without Vitamin D Deficiency Included in This Study
Figure 1 Comparison of 25(OH)D between the NAFLD group and the non-NAFLD group in participants with T2DM: (A) all participants; (B) participants with BMI >23kg/m2; (C) participants with BMI ≤23kg/m2.
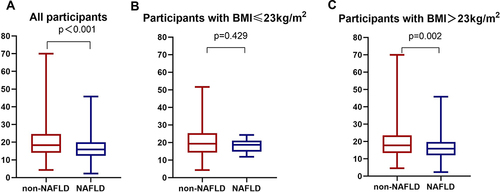
Figure 2 Comparison of the prevalence of NAFLD in T2DM patients with and without vitamin D deficiency: (A) all participants; (B) participants with BMI >23kg/m2; (C) participants with BMI ≤23kg/m2.
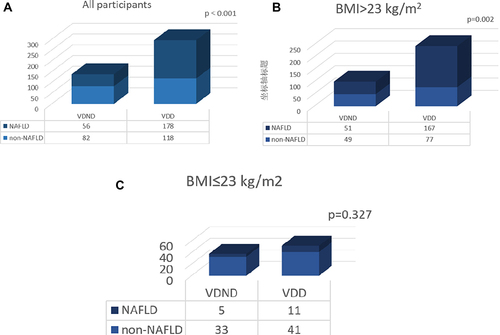
Figure 3 Spearman correlation analysis of 25(OH)D with potential risk factors for NAFLD.
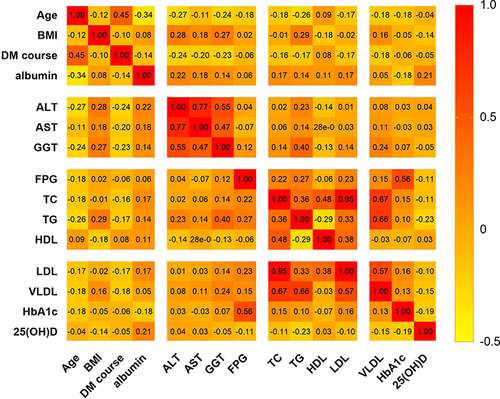
Table 3 Logistic Regression Analysis of Vitamin D Deficiency for NAFLD in Patients with T2DM
Table 4 Logistic Regression Analysis of Vitamin D Deficiency for NAFLD in T2DM Patients with BMI ≤23kg/m2
Table 5 Logistic Regression Analysis of Vitamin D Deficiency for NAFLD in T2DM Patients with BMI >23kg/m2
Table 6 Effect of Vitamin D Deficiency on NAFLD Risk Stratified by Subgroups