Figures & data
Table 1 Clinical and Laboratory Data in Participants Grouped by Fatty Liver Degree
Figure 1 The main characteristics of study participants by quartiles of serum TXNIP. Data are the mean±SD.
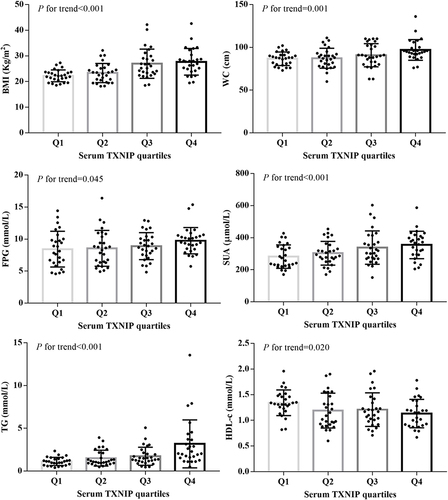
Figure 2 Prevalence of fatty liver by severity, as a function of TXNIP quartile.TXNIP quartile: Q1: ≤290.99 pg/mL, Q2: 290.99~348.71 pg/mL, Q3: 348.71~413.70 pg/mL, Q4: >413.70 pg/mL.
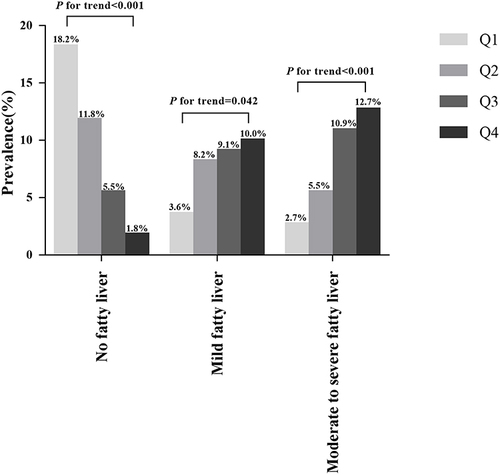
Table 2 Associations Between TXNIP and Different Degrees of Fatty Liver After Controlling for Confounding Factors
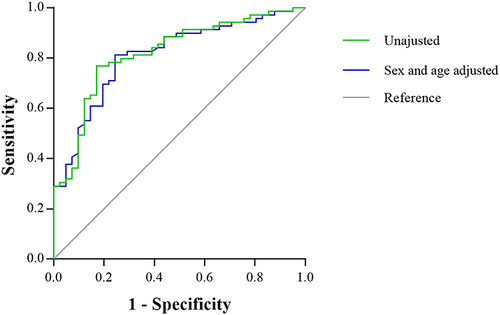
Figure 3 Receiver operating characteristic (ROC) curves for TXNIP and in patients with T2DM. Unadjusted: AUC=0.811(95% CI: 0.729~0.893, P<0.001); Sex and age adjusted: AUC=0.820 (95% CI: 0.739~0.900, P<0.001).