
Figures & data
Table 1 The Characteristics and Anthropometric Features of the KPT2D and NKPT2D Patients in This Study
Table 2 Biochemical Parameters of the Subjects
Figure 1 Comparison of atherosclerotic among the two groups. (A) The prevalence of atherosclerosis among the two groups. (B) Comparison of atherosclerosis stratified by age. (C) The prevalence of atherosclerosis among the age-paired subjects. (D) Comparison of atherosclerosis stratified by gender. (E) Comparison of atherosclerosis stratified by BMI.
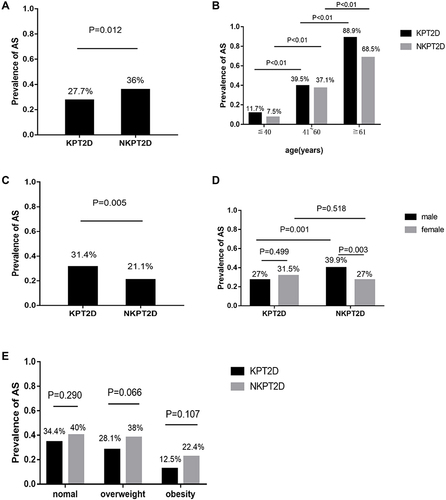
Table 3 Results of Binary Logistic Regression Analysis of the Risk Factors for Atherosclerosis