Figures & data
Table 1 The Primary Characteristics of Patients with DM Alone, Diabetic Ketosis (DK), and Diabetic Ketoacidosis (DKA) Revealed That DKA Had a Significantly Lower Age, BMI, Duration of Diabetes, and a Higher HbA1c
Figure 1 Characteristics differed between DM alone, DK and DKA groups regarding one indicator of the pancreatic function, fasting C-peptide (A) fasting C-peptide was significantly lowest in DKA; an indicator for the glucose controlling in the past 3–4 months, HbA1c (B) HbA1c was significantly higher in both DK and DKA when compared with DM alone.
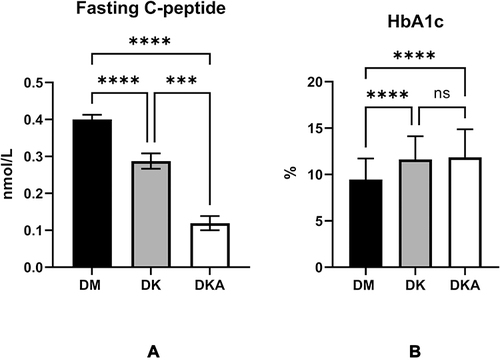
Figure 2 Diabetic ketoacidosis causes the serum 25-OH-VitD3, the main reservoir of vitamin D, and precursor of the active 1.25-OH-VitD3 (A), N-MID, the biomarkers of osteoblast activity (C), blood calcium, which contains ionized calcium (E), to decrease while the bone-breaking marker of osteoclast, β-CTX (B). Nevertheless, the PTH level, which increases blood calcium by promoting calcium reabsorption in bone, intestine, and kidney (D), did not display any disparity among groups.
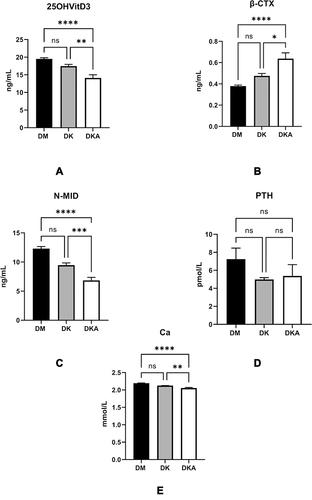
Figure 3 Comparisons of N-MID level in DM alone, DK and DKA; (A) in males, we could observe an overt tendency of decline at both ages <50 and >50 in DM alone, DK, and DKA respectively; (B) in females, the tendency at age<50 was not significant, but at age>50, these differences may be due to the hormonal milieu and the sample size of the age above and below 50 years old; (C) β-CTX in male showed increase tendency in DM alone, DK and DKA, respectively; (D) in female, the increased tendency was not distinct at age<50, but at age>50.
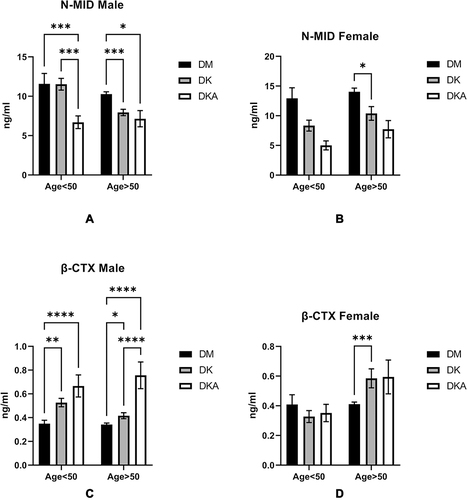
Figure 4 Thyroid function was influenced by dysregulation of glucose metabolism in DK and DKA. We found that the levels of TSH (A) and thyroid hormone TT4 (B) Free T3 and T4 (C) were substantially reduced in DKA. TT3/TT4 (D) and FT3/FT4 (E) indicators of thyroid function also display lower levels in DKA.
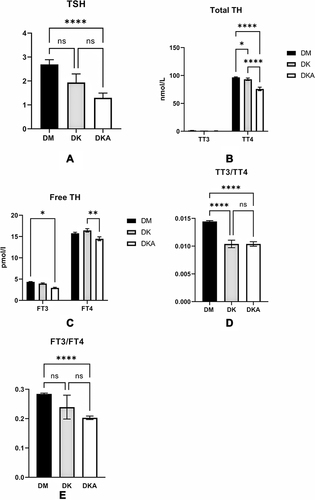
Figure 5 Comparisons of thyroid function in DM alone, DK, and DKA; (A) in males, we observed a distinct declining tendency at both ages <50 and >50 in DM alone, DK, and DKA respectively; (B) in males, this tendency was overt in TT3 at both age>50 and age<50; (C) we could only observe a significant decrease in FT4 in DKA of males at age<50; (D) the decreasing tendency was significant at both ages; (E) We saw a declining trend at both ages of TSH, but it was not statistically significant; (F) In females, the declining of TT4 was overt at age>50; (G) We could find that the TT3 was lower significantly in DKA at both ages; (H) we could find the DKA groups at both ages had lower FT4 level, but there was no significance; (I) we could observe the declining trend at both ages, but it was clear in a group with age>50; (J) in males, the decreased TSH in DK and DKA did not reach the statistical significance.
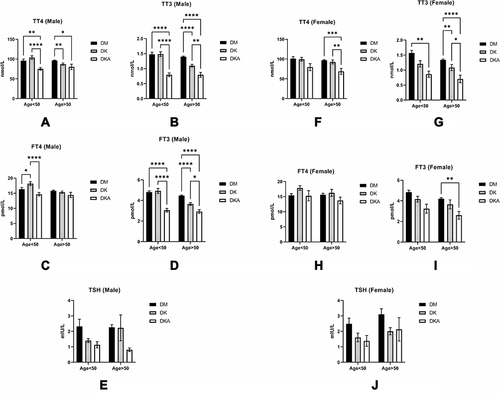
Figure 6 The heatmap depicts the correlational relationships in analyzed variables of three groups. We found that β-CTX (r=0.38, p<0.05), TT3 (r=0.40, p<0.05), and FT3 (r=0.38, p<0.05) were positively (displayed in red color) correlated with N-MID, while HbA1c (r=−0.32, p<0.05) was negatively (shown in blue color) correlated with N-MID. The gradient in red represents the degree of positive correlation, while the gradient in blue represents the degree of negative correlation, as shown by the color bar on the right side of the map.
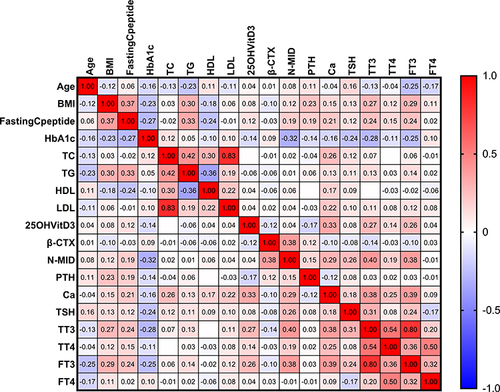
Figure 7 The heatmap depicts the relationship between other variables and the N-MID of the DM alone group. In the map, we found that the β-CTX (r=0.54, p<0.05) was only strongly positively (displayed in red color) correlated with the N-MID, whereas the HbA1c (r=−0.27, p<0.05) was negatively (displayed in blue color) correlated with N-MID. The gradient degree in red represents the degree of positive correlation. In contrast, the gradient degree in blue represents the degree of negative correlation, as shown by the color bar on the right side of the map.
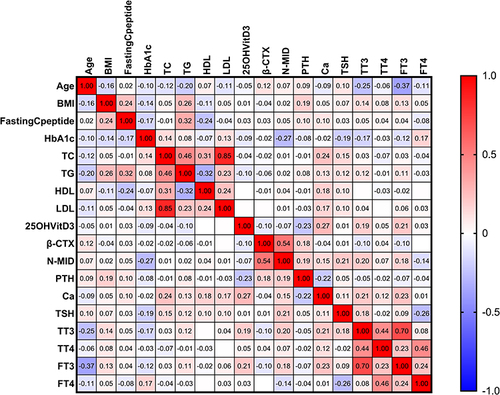
Figure 8 The heatmap depicts the correlation between the other variables and the NMID of the DK group. We found that β-CTX (r=0.34, p<0.05), Ca2+ (r=0.43, p<0.05), TT3 (r=0.62, p<0.05) and FT3 (r=0.61, p<0.05) were strongly positively (displayed in red color) correlated with N-MID, whereas age (r=−0.27, p<0.05) was strongly negatively (displayed in blue color) correlated with N-MID. The degree of the gradient in red represents the degree of positive correlation, and the degree of the gradient in blue represents the degree of negative correlation, as shown in the map’s right color bar.
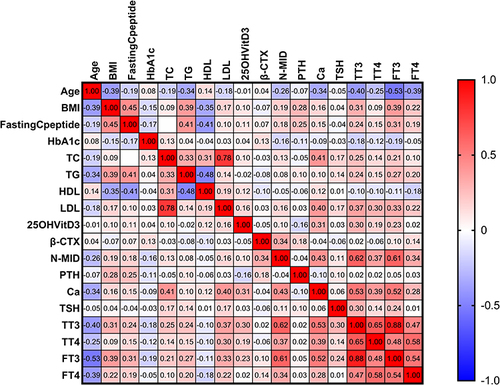
Figure 9 The heatmap depicts the correlation between the other variables and N-MID in the DKA group. We found that β-CTX (r=0.49, p<0.05), TT3 (r=0.45, p<0.05), FT3 (r=0.43, p<0.05) was strongly positively (displayed in red color) correlated with N-MID, but TG (r=−0.24, p<0.05) was strongly negatively (displayed in blue color) correlated with N-MID. The gradient in red represents the degree of positive correlation, while the gradient in blue represents the degree of negative correlation, as shown by the color bar on the right side of the map.
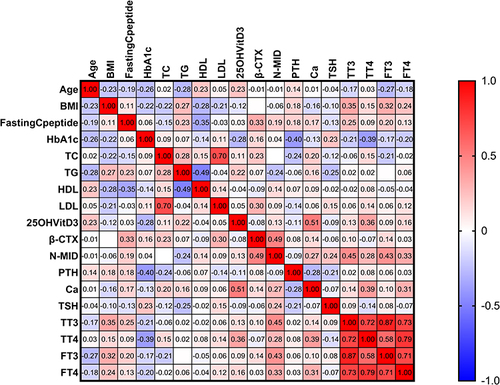
Table 2 A Multilinear Regression Model of N-MID in DM Group Alone Revealed That β-CTX, TT3, HbA1C, and 25-OH-VitD3 Were Independent Driving Factors of the Change in N-MID. Specifically, β-CTX and TT3 Levels Were Positively Related to N-MID, While HbA1c and 25-OH-VitD3 Were Negatively Related to N-MID. These Parameters Could Explain 44.9% (R Square Was 0.449) of the Observed N-MID Change in the Current Study
Table 3 A Multilinear Regression Model of N-MID in DK Group Revealed That Only β-CTX and FT3 Were Independently Driving Factors of N-MID, Which Was Positively Related to N-MID. These Parameters Could Explain 47.9% (R Square Was 0.479) of N-MID Change in the Current Study
Table 4 A Multilinear Regression Model of N-MID in DKA Group. The Levels of β-CTX, FT3, and TG Were the Independent Driving Factors of N-MID Change. Besides TG, The Other Three Variables Were Positively Related to N-MID Change. This Model Could Explain 40% (R Square Was 0.400) of the Observed N-MID Change in the Current Study
Table 5 A Multilinear Regression Model of N-MID in RDK Group. The Level of β-CTX Was the Only Independent Driving Factor of the Change in N-MID. The Level of β-CTX Was Positively Related to N-MID, and This Model Could Explain the 56.8% (R Square Was 0.568) Change of the Observed N-MID Change in the Current Study
Figure 10 The comparisons of the levels of 25-OH-VitD3 (A), PTH (B), Ca2+ (C), N-MID (D), and β-CTX (E), we found that only the level of 25-OH-VitD3 was significantly reduced in the RDK group (p<0.05).
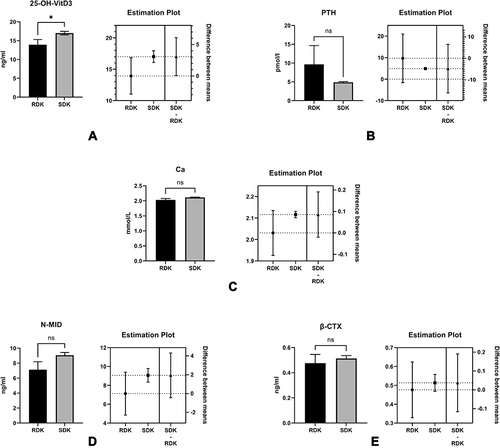
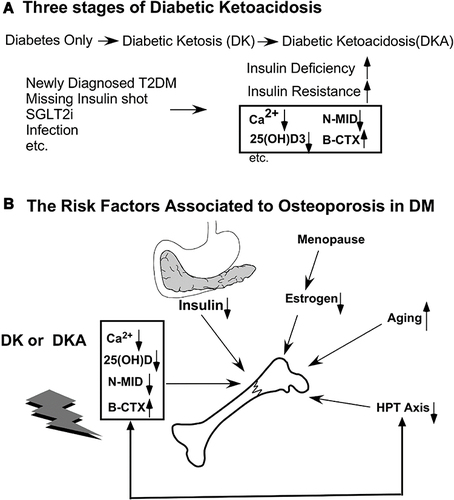
Figure 11 The relationship between bone turnover markers and diabetic ketoacidosis (DKA) conditions. (A) Many risk factors, such as missing insulin shots, infection, and unawareness of DM in individuals with newly diagnosed diabetes, can all lead to ketoacidosis. (B) Besides the factors that cause osteoporosis (OP), such as deficiency of insulin, abnormal estrogen after menopause in women, aging, and imbalance of the hypothalamus-pituitary-Thyroid (HPT) axis, diabetic ketoacidosis causes serum Ca2+, 25 (OH) D, N-MID to decrease while the bone-breaking marker, β-CTX, to increase.