Figures & data
Table 1 Main Ingredients of Yishen Capsule
Figure 1 Common targets of Yishen capsule ingredients and diabetic nephropathy. (A) Venn diagram. Venn diagram shows the intersection of Yishen Capsule target genes and DN disease target genes, and the overlapping part is the number of intersection target genes. (B) PPI network of the common targets of Yishen Capsule and diabetic nephropathy. (C) PPI protein interaction network diagram. The nodes in the picture represent the common target proteins, and the color depth is positively correlated with the degree value of the node.
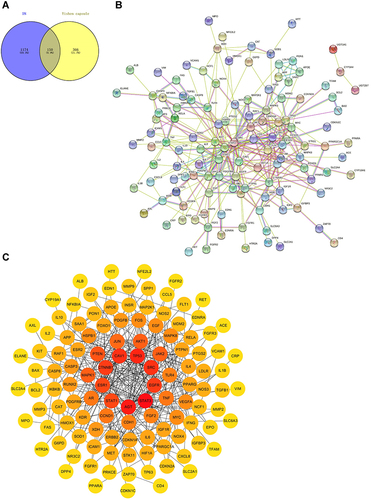
Figure 2 GO and KEGG pathway enrichment analysis. (A–C) The BP, CC and MF of GO enrichment analysis, respectively. (D) The KEGG signal pathway analysis. The size of the dot indicates the number of enriched genes. The color from blue to red indicates significance. The smaller the p.value, the more significant the difference.
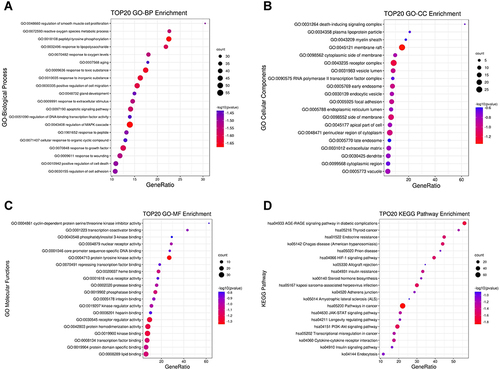
Table 2 Network Node Characteristic Parameters of the Main Active Ingredients of Yishen Capsule
Table 3 The Characteristic Parameters of the Target Network Node of the Main Active Ingredients of Yishen Capsule
Figure 3 Network diagram and Venn diagram. (A) The inverted triangle node represents the name of the pathway, the octagonal node represents the active ingredient of traditional Chinese medicine, and the diamond node represents the gene. The larger the node area of the traditional Chinese medicine component, the more the number of genes enriched by this component, or the more this component is enriched in the pathway. (B) Venn diagram shows the intersection of the key target genes screened by the drug-disease-pathway network diagram and the key target genes screened by the PPI network.
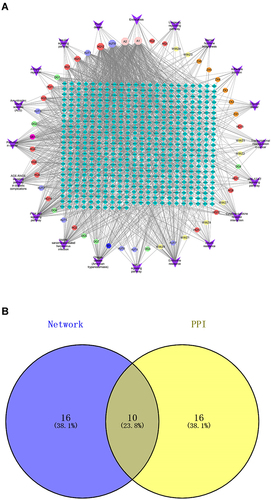
Figure 4 The molecule docking heat map of the key active compounds in the Yishen capsule and the core target proteins. (A) The vertical axis represents the effective active ingredient of Yishen capsule and the horizontal axis represents the core target protein receptor. Each value represents the total score of molecular docking, and the darker the color, the higher the score. (B) Docking analysis of formononetin with AKT1 receptor. (C) Docking analysis of formononetin with STAT3 receptor. (D) Docking analysis of formononetin with TP53 receptor. (E) Docking analysis of β-sitosterol with AR receptor. (F) Docking analysis of β-sitosterol with TP53 receptor. (G) Docking analysis of Calycosin with HIF-1α receptor. (H) Docking analysis of Calycosin with JAK2 receptor. For all the docking analysis results, the right panel shows the global diagram of the simulated docking of each ligand molecule and the receptor protein. The colored ribbon model, the protein structure. The yellow grid structure, the ligand molecule. The left panel is a partial three-dimensional image of simulated docking. Wheat, small ligand molecules. Green, amino acid residues that have interaction with active molecules. The yellow dashed line, interacting hydrogen bonds. The blue dashed line, Pi-Pi Stacked. The magentas dashed line, Pi-Alkyl interaction.
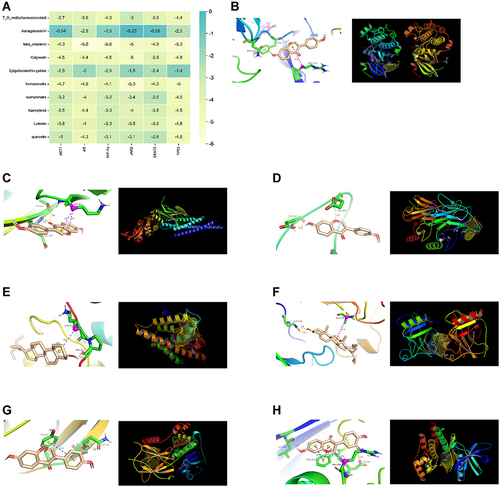
Figure 5 Pathological analysis of rat kidney tissues in each group (×100,×200,×400). (A) HE staining of rat kidney tissue. In the DN group, the glomerular capillary loops were hypertrophy, the basement membrane was thickened, the mesangial cells and mesangial matrix were proliferated, and the renal tubular epithelial cells were hypertrophy, while there was no glomerular sclerosis or interstitial fibrosis. Compared with the DN group, the above-mentioned lesions in the YS group were reduced to varying degrees. (B) PAS staining. PAS-positive protein deposits can be seen in the glomerular mesangial area and renal tubular epithelial cells of rats in the DN group (Arrows in the figure). Compared with the DN group, the YS group had less PAS-positive protein deposition. (C) Masson staining. There were no abnormal changes in the morphology and structure of the kidney tissue in the normal group. Masson staining rarely showed blue staining of collagen tissue. The glomerulus volume of rats in the DN group increased, the renal tubular epithelial cells were obviously edema, and the lumen became narrow. Masson staining showed blue-stained collagen tissue (Arrow in the figure). Compared with the DN group, the YS group had increased glomerular volume, reduced renal tubular epithelial cell edema, and decreased blue-stained collagen tissue.
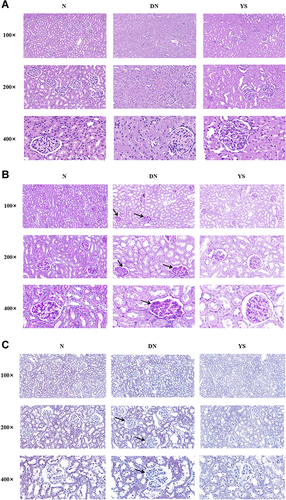
Figure 6 Immunohistochemical detection and quantitative analysis of HIF-1α (A), STAT3 (B) and JAK2 (C) in kidney tissues of rats in each group. The expression of HIF-1α, STAT3 and JAK-2 in the DN group was higher than that in the N group. The expression of HIF-1α was further up-regulated in the YS group (P<0.05). The expression of STAT3 and JAK-2 in the YS group were decreased compared with the DN group (P<0.05). *Compared with the N group P<0.05, **Compared with the DN group P<0.05.
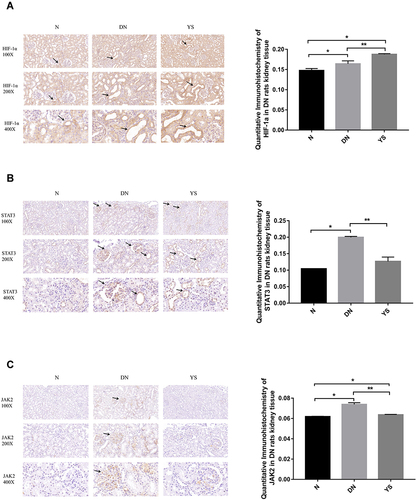
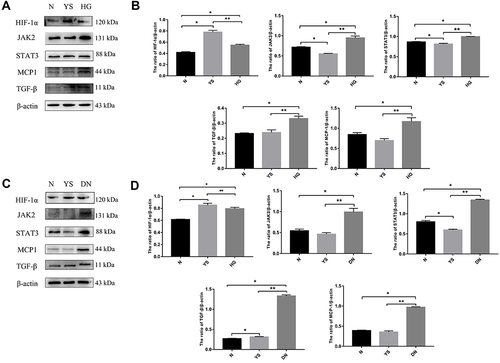
Figure 7 Western blotting and quantitative analysis. (A and B) The expression and quantitative analysis of key proteins in NRK-52E cells. After HG stimulation, the expression of HIF-1α, JAK-2, STAT3, TGF-β and MCP-1 protein increased in NRK-52E cells. After Yishen Capsule treatment, compared with the HG group, the expression of HIF-1α in NRK-52E further increased, while the expression of JAK2, STAT3, MCP-1 and TGF-β decreased. (C and D) The expression and quantitative analysis of key proteins in kidney tissue. Compared with the normal group (N), the expression of HIF-1α, JAK-2, STAT3, TGF-β and MCP-1 protein in the kidney tissue of the DN group increased. After treatment with Yishen Capsule, the expression of HIF-1α increased compared with the DN group. Compared with the DN group, the expressions of JAK2, STAT3, MCP-1 and TGF-β all decreased after treatment with Yishen capsule. *Compared with the N group P<0.05, **Compared with the DN group P<0.05.