
Figures & data
Table 1 The Demographic Data and Biochemical Parameters of the Examined Patients
Figure 1 Flowchart of the patient selection process.
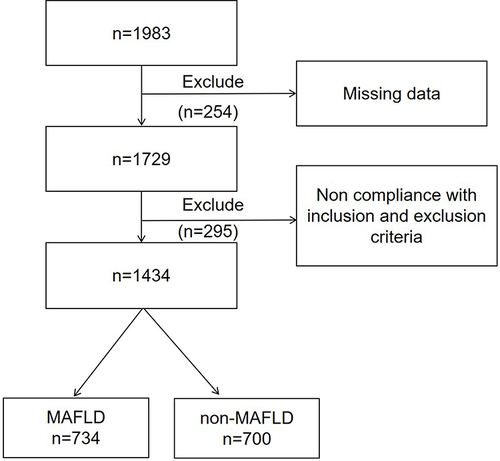
Figure 2 Comparison of serum uric acid-to-creatinine ratio (SUA/Cr) between the metabolic-associated fatty liver disease (MAFLD) group and the non-MAFLD group in participants with type 2 diabetes mellitus (T2DM).
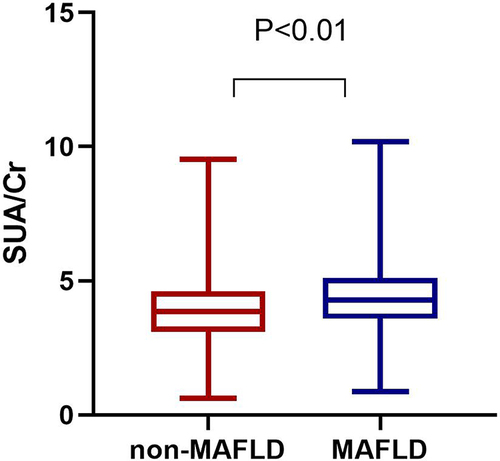
Figure 3 Comparison of the prevalence of metabolic-associated fatty liver disease (MAFLD) in patients with type 2 diabetes mellitus (T2DM) who have different serum uric acid-to-creatinine ratios (SUA/Cr).
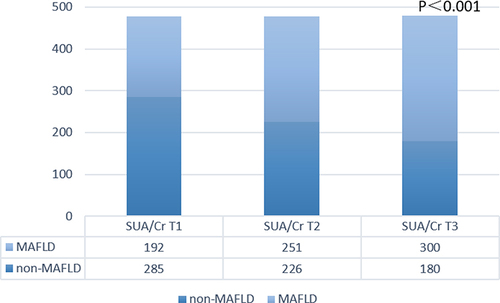
Figure 4 Spearman correlation analysis of serum uric acid-to-creatinine ratio (SUA/Cr) with potential risk factors for metabolic-associated fatty liver disease (MAFLD). (A) All patients with type 2 diabetes mellitus (T2DM), (B) patients with T2DM but without MAFLD, (C) patients with T2DM and MAFLD.
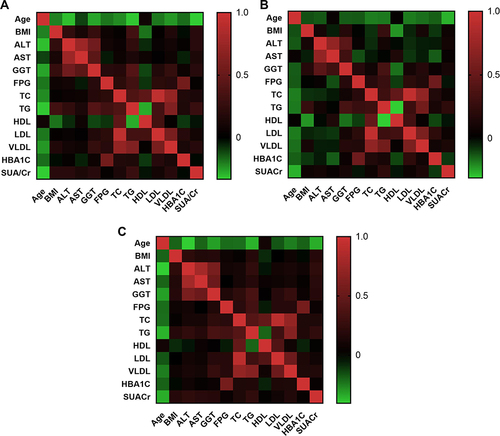
Table 2 Logistic Regression Analysis of SUA/Cr for MAFLD in Patients with T2DM
Table 3 Effect of Magnitude of SUA/Cr on MAFLD Risk Stratified by Subgroups