Figures & data
Figure 1 Changes in the estimated glomerular filtration rate (eGFR) and urinary albumin–creatinine ratio (UACR) in the anagliptin (ANA) and sitagliptin (SITA) groups. The bars indicate the standard errors.
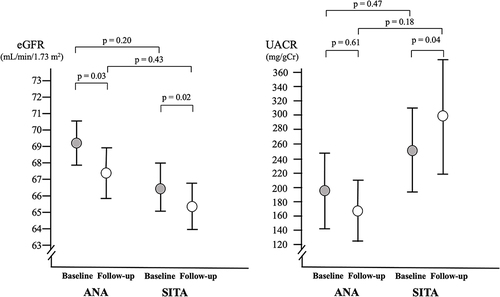
Table 1 Patient Characteristics
Table 2 Clinical Parameters at Baseline and Final Follow-Up and Difference
Table 3 Relationship Between the Differences in Renal Function and Clinical Parameters
Figure 2 Subgroup analyses of the difference in the estimated glomerular filtration rate (eGFR).
Abbreviations: ANA, anagliptin; CI, confidence interval; DPP-4, dipeptidyl peptidase-4; eGFR, estimated glomerular filtration rate; RAAS, renin–angiotensin–aldosterone system; SGLT2, sodium-glucose co-transporter 2; SITA, sitagliptin.
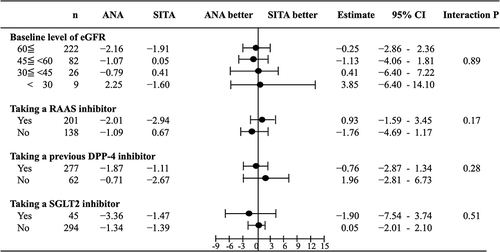
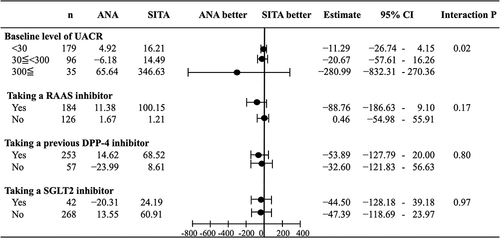
Figure 3 Subgroup analyses of the difference in the urinary albumin–creatinine ratio (UACR).
Abbreviations: ANA, anagliptin; CI, confidence interval; DPP-4, dipeptidyl peptidase-4; eGFR; RAAS, renin–angiotensin–aldosterone system; SGLT2, sodium-glucose co-transporter 2; SITA, sitagliptin; UACR, urinary albumin–creatinine ratio.