Figures & data
Table 1 Basic Demographic and Clinical Characteristics of Participants
Figure 1 The prevalence of diabetic inpatients with elevation of tumor markers.
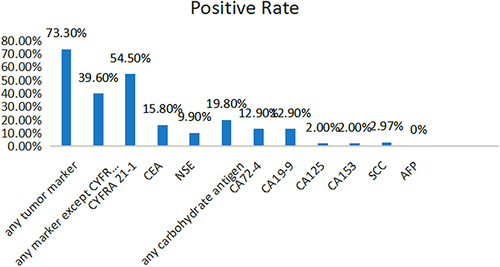
Figure 2 The rate of diabetic inpatients with elevation tumor markers that returned to normal after controlling blood glucose.
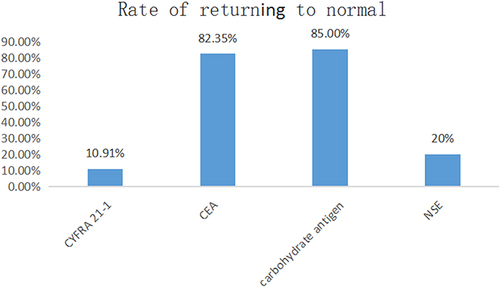
Figure 3 The proportion of diabetic patients with elevation of CYFRA 21–1 between the two groups, the HbA1c ≤8% group and the HbA1c >8% group (p = 0.244).
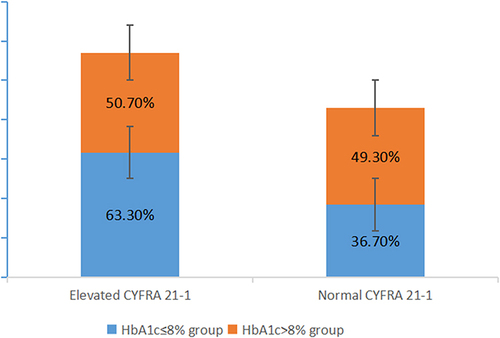
Table 2 Comparison Between the Elevated CYFRA 21–1 Group and the Normal CYFRA 21–1 Group
Table 3 Comparison Between the Group with Elevated Tumor Markers Except CYFRA 21–1 and the Group with Normal Tumor Markers
Table 4 Comparison Between the Group with Elevation of CEA and the Group with Normal CEA
Table 5 Comparison Between the Group with Elevation of Carbohydrate Antigen and the Group with Normal Carbohydrate Antigen
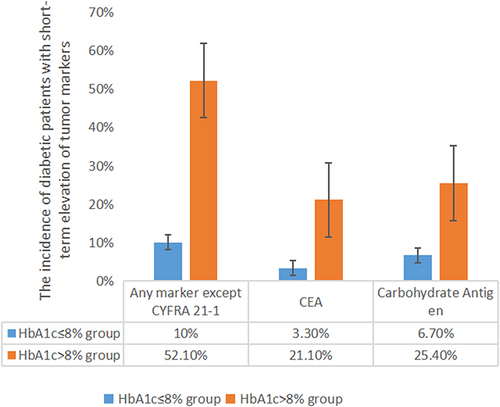
Figure 4 Compare the proportion of diabetic inpatients with elevation of tumor markers between the high blood glucose group and the lower blood glucose group.