Figures & data
Table 1 Population characteristics
Figure 1 Relationship between metabolic markers and BMI by BMI group.
Notes: Unweighted and untransformed values for biomarkers and BMI were plotted on a single graph with green open circles (o) representing subjects who fall in the normal weight range, orange plus signs (+) representing those that fall in the overweight range, and red exes (x) representing those who fall in the obese range. The top 1% of biomarker values for HbA1c were removed from the graph to exclude potential outliers. Unadjusted linear regression lines within each BMI group were plotted to highlight trends in the data (shown in blue). Gray dotted lines are shown vertically on the graph to represent the cut-points between normal weight, overweight, and obese. Regression coefficients (β), standard errors, and P-values were calculated using weighted linear regression adjusted for age, sex, smoking status, physical activity, and ethnicity. BMI, triglycerides, and HbA1c were log-transformed to improve normality in linear regression models.
Abbreviations: BMI, body mass index; HbA1c, glycosylated hemoglobin; LDL-C, low-density lipoprotein cholesterol; HDL-C, high-density lipoprotein cholesterol; Total:HDL-C ratio, total cholesterol/HDL ratio; SE, standard error.
Abbreviations: BMI, body mass index; HbA1c, glycosylated hemoglobin; LDL-C, low-density lipoprotein cholesterol; HDL-C, high-density lipoprotein cholesterol; Total:HDL-C ratio, total cholesterol/HDL ratio; SE, standard error.
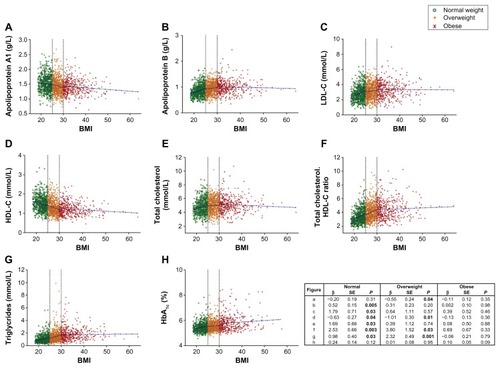
Figure 2 Relationship between BMI and biomarkers of inflammation and plasma vitamin D by BMI groups.
Notes: Unweighted and untransformed values for biomarkers and BMI were plotted on a single graph with green open circles (o) representing subjects who fall in the normal weight range, orange plus signs (+) representing those that fall in the overweight range, and red exes (x) representing those who fall in the obese range. The top 1% of biomarker values for 25(OH)D were removed from the graphs to exclude potential outliers. Unadjusted linear regression lines within each BMI group were plotted to highlight trends in the data (shown in blue). Gray dotted lines are shown vertically on the graph to represent the cut-points between normal weight, overweight, and obese. Regression coefficients (β), standard errors, and P-values were calculated using weighted linear regression adjusted for age, sex, smoking status, physical activity, and ethnicity. BMI, CRP, fibrinogen, homocysteine, and 25(OH)D were log-transformed to improve normality in linear regression models.
Abbreviations: BMI, body mass index; 25(OH)D, 25-hydroxyvitamin D; CRP, C-reactive protein; SE, standard error.
Abbreviations: BMI, body mass index; 25(OH)D, 25-hydroxyvitamin D; CRP, C-reactive protein; SE, standard error.
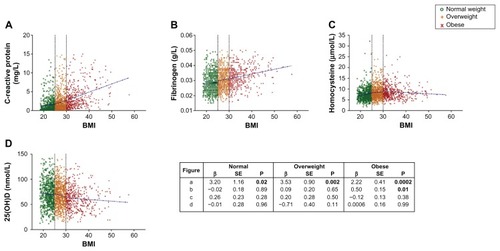
Table 2 Adjusted mean levels of biomarkers by BMI groups