
Figures & data
Table 1 Comparison of Clinical Characteristics of CHB with and without MAFLD, Stratified by HBeAg Status
Table 2 Comparison of Pathological Characteristics of CHB with and without MAFLD, Stratified by HBeAg Status
Figure 1 Comparison of liver activity score and fibrosis stage distributions between MAFLD-CHB and non-MAFLD-CHB groups under the NASH CRN system, stratified by HBeAg status (A) Comparison of liver activity score distribution; (B) Comparison of liver fibrosis stage distribution; (C) Comparison of proportion of A ≥3; (D) Comparison of proportion of F ≥2; MAFLD-CHB, defined as patients fulfilling the criteria for both MAFLD and CHB; Non-MAFLD-CHB, defined as patients who met the diagnostic criteria for CHB but did not meet the diagnostic criteria for MAFLD.
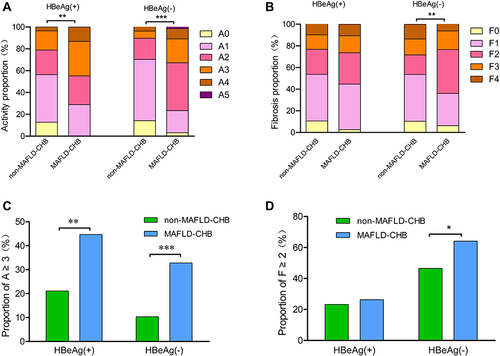
Table 3 Univariate Analysis of Factors Associated with Moderate-to-Severe Liver Activity (A ≥3) and Significant Fibrosis (F ≥2) in Patients with CHB
Table 4 Multivariate Analysis of Factors Associated with Moderate-to-Severe Liver Activity (A≥3) in Patients with CHB and Stratified by HBeAg Status
Table 5 Multivariate Analysis of Factors Associated with Significant Fibrosis (F≥2) in Patients with CHB and Stratified by HBeAg Status