Figures & data
Figure 1 (A) Sagittal scan of carotid ultrasonogram. (B) Longitudinal scan of carotid ultrasonogram. Measurement of IMT (*) at posterior wall of carotid artery bifurcation is shown.
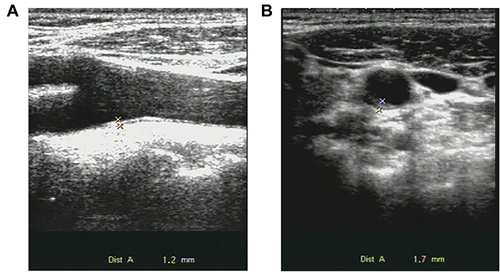
Table 1 Characteristics of All Study Groups Presented Separately in Groups with Poor and Favorable Outcomes
Table 2 Characteristics of Study Groups Presented Separately in Patients with DM (-) and T2DM (+)
Table 3 Linear Regression Analysis of Relationships Between Short-Term Functional Outcomes and Variables in Non-Cardiogenic Stroke Patients with T2DM (+)
Table 4 Linear Regression Analysis of Relationships Between Short-Term Functional Outcomes and Variables in Non-Cardiogenic Stroke Patients with DM (-)
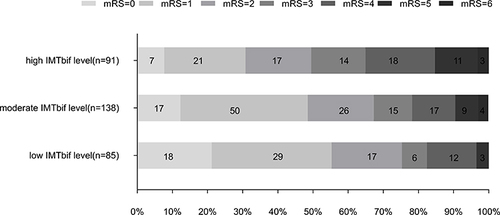
Figure 2 Functional outcomes at 3 months stratified for IMT levels at carotid bifurcation.