
Figures & data
Table 1 Comparison of Clinical and Biochemical Features of Patients with T2DM
Figure 1 Flow diagram. The chart shows patient inclusion and exclusion in the study.
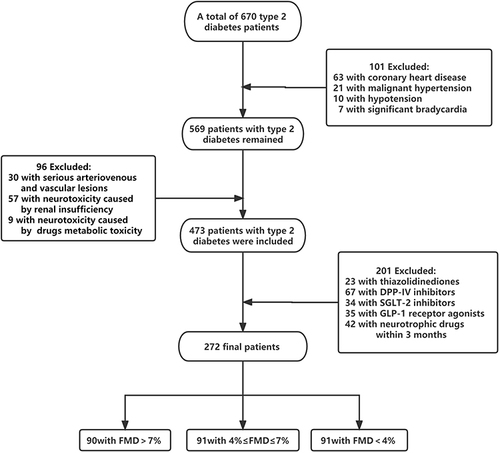
Table 2 Proportion of Peripheral Neuropathy Severity in Three Groups
Figure 2 Scatter diagram of FMD and TCSS (0–19 points).
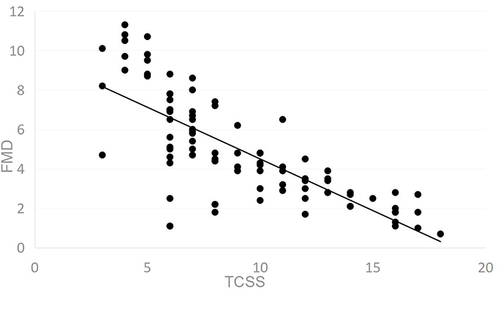
Table 3 Abnormal Ratio of TCSS Indicators of Three Groups
Table 4 Correlation Between Components of TCSS and FMD
Table 5 Comparison of Peripheral Motor Nerve Measurements in Three Groups
Table 6 Correlation Analysis of Motor Nerve CV; Amp; DML and FMD
Table 7 Multiple Linear Regression Analysis of Risk Factors for Endothelial Function Injury in T2DM