
Figures & data
Table 1 Population Descriptive of Study Participants
Table 2 Differences in Biochemical Parameters Among the T2DM Patients and Healthy Controls
Table 3 Differences in Biochemical Parameters Among the T2DM with and without Obesity
Figure 1 mRNA expression (A) FNDC-5 expression in T2DM patients with and without obesity (B) Selectin-E expression in T2DM patients with and without obesity.
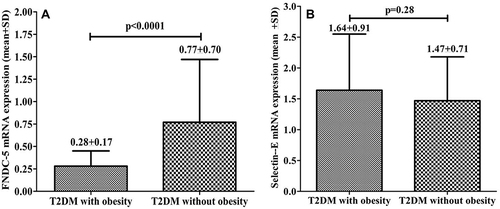
Figure 2 Comparison of mRNA expression (A) FNDC-5 among T2DM patients with serum Vitamin D level deficient, insufficient, and sufficient. (B) Selectin-E among T2DM patients with serum Vitamin-D level deficient, insufficient, and sufficient.
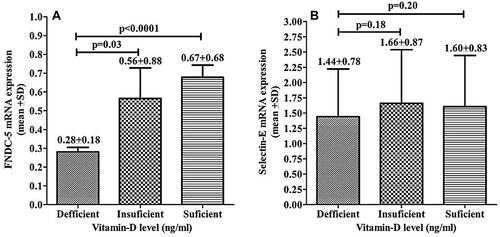
Figure 3 Comparison of mRNA expression of (A) FNDC-5 in T2DM patients with normal and deficient Vitamin B12. (B) Selectin-E in T2DM patients with normal and deficient serum Vitamin B12 level.
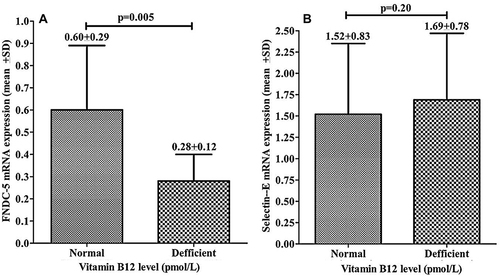
Figure 4 ROC curve for FNDC5 and Selectin-E among the T2DM patients with obesity vs without obesity.
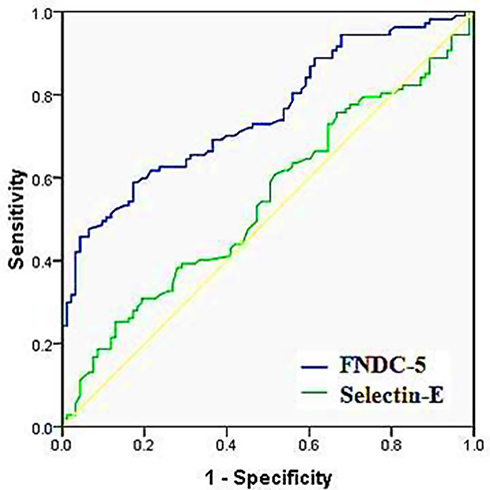
Table 4 ROC Curve to Presenting the AUC for FNDC-5 and Selectin-E Among the T2DM with Obesity Vs Without Obesity
Table 5 Correlation Analysis of FNDC-5 and Selection-E with Biochemical Parameters