
Figures & data
Table 1 Comparison of General Information, Abdominal Visceral Fat, Plasma Glucose, CPET, and Other Indicators
Figure 1 Comparison of AVF, FPG, and PPG levels among three quantile groups of cardiopulmonary function indexes.
Abbreviations: AT, anaerobic threshold; VO2, oxygen uptake; VO2/kg, VO2 per kg of body weight; HR, AT heart rate; AVF, abdominal visceral fat; FPG, fasting plasma glucose; PPG, postprandial plasma glucose.
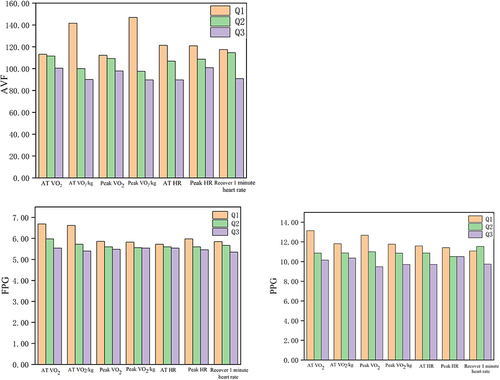
Table 2 Single-Factor Correlation Analysis of Plasma Glucose and Abdominal Visceral Fat with Anaerobic Threshold VO2, Anaerobic Threshold VO2/Kg, Peak VO2, Peak VO2/Kg, Anaerobic Threshold Heart Rate, Peak Heart Rate, and 1-Minute Heart Rate Recovery