Figures & data
Figure 1 (A) Birth weight, (B) body weight (age 20 weeks), (C) food intake of mice in each group. Data were presented as the mean ± standard deviation; *p<0.05 vs NBW (Student’s t test).
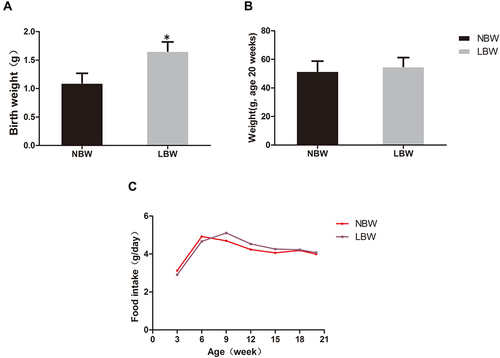
Figure 2 (A) IPGTT, (B) fasting blood glucose, (C) serum insulin, (D) HOMA-IR, (E) TC, (F) TG of mice in each group. Data were presented as the mean ± standard deviation; *p<0.05 vs NBW (Student’s t test).
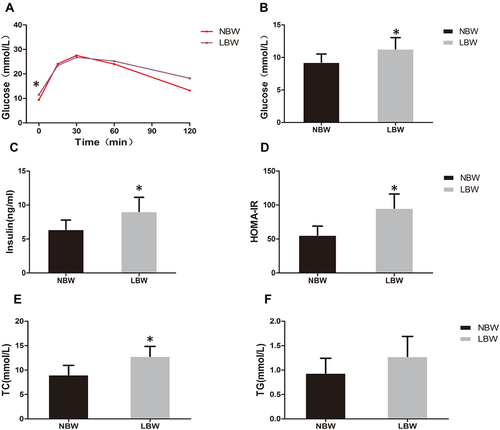
Figure 3 (A) Weight ratio of liver, (B) muscle, (C) adiposity index (g/100g of body weight) of mice in each group. Data were presented as the mean ± standard deviation; *p<0.05 vs NBW (Student’s t-test).
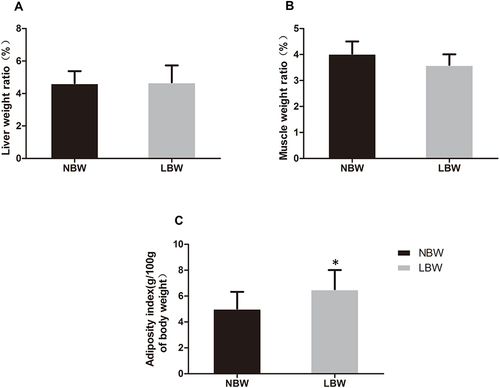
Figure 4 (A) HE staining of adipose tissue, (B) oil red O staining of liver, (C) TG content in muscle. Data were presented as the mean ± standard deviation; *p<0.05 vs NBW (Student’s t-test).
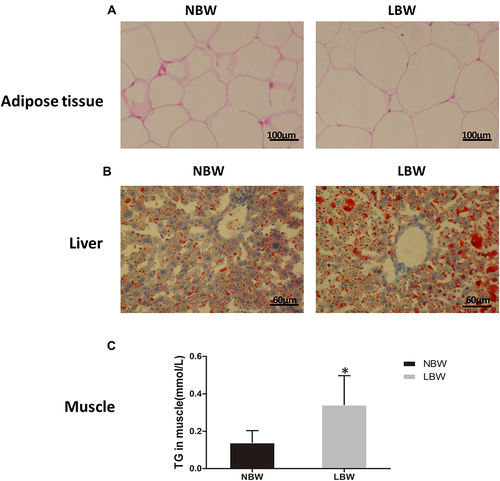
Figure 5 (A) Quantitative information, (B) GO analysis, (C) KEGG pathway enrichment analysis of differential proteins in LBW/NBW.
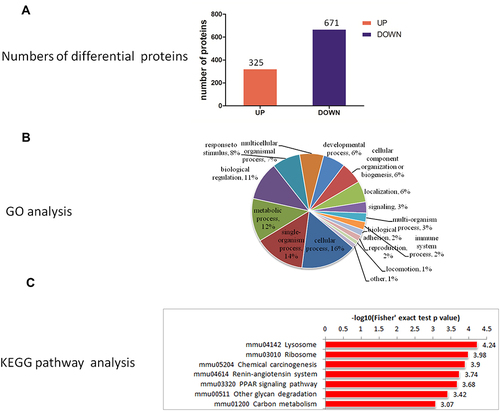
Figure 6 Network of PPAR pathways.
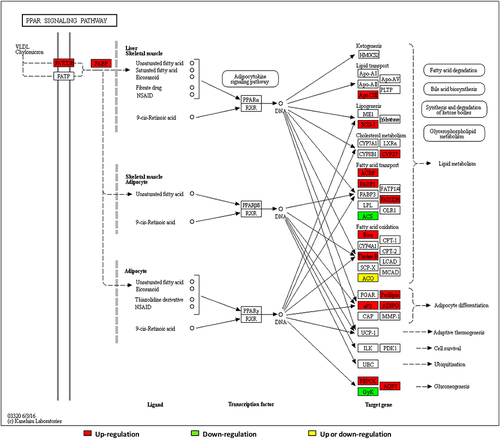
Figure 7 PPAR pathways cluster analysis heatmap.
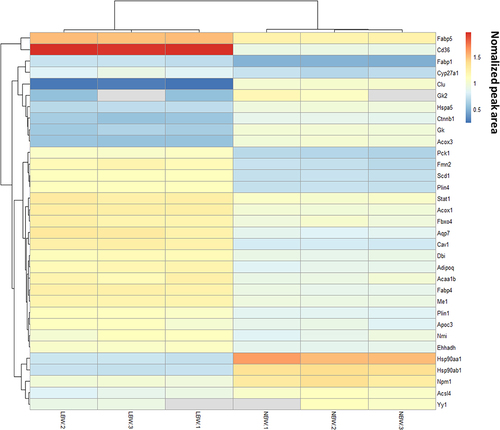
Figure 8 The ion peak normalized area of CD36, SCD1, and PCK1 in each group with (A) TMT and (B) PRM. Western blot verified the expression of PPARγ in the NBW/LBW groups. (C) Quantitation analysis of PPARγ expression standardised by GAPDH. (D) Western blot picture. Data were presented as the mean ± standard deviation; *p<0.05 vs NBW (Student’s t test).
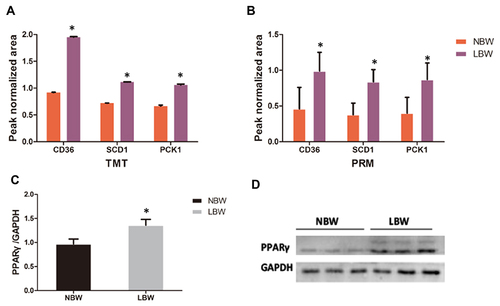
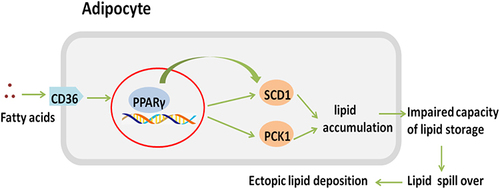
Figure 9 CD36/PPARγ/SCD1 and CD36/PPARγ/PCK1 pathway.