Figures & data
Figure 1 GLP-1RA reduces body weight, lowers blood glucose, and improves kidney function. (A) Schematic presentation of the experimental design and protocol. (B) The gross appearance of the kidney among three groups. (C) Body weight, kidney weight and blood glucose of mice among three groups (n = 10). (D) Comparison of body weight and blood glucose of mice among three groups in different periods (n = 10). (E) Scr and BUN of mice among three groups (n = 10). Data are expressed as mean ± SD, *P<0.05, **P<0.01 vs control group; #P<0.05, ##P<0.01 vs DKD group.
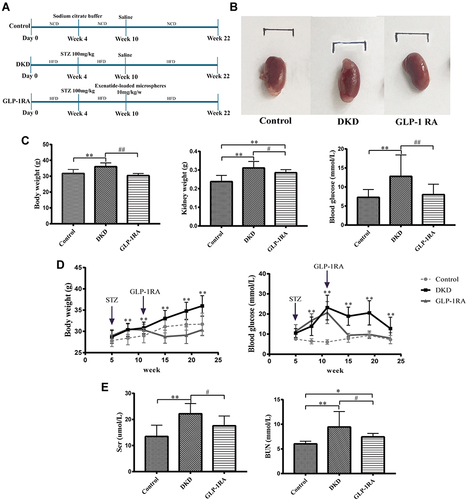
Table 1 Gene-Specific Primers for qPCR Analysis
Figure 2 GLP-1RA improves renal tubular injury in DKD mice. (A–C) H&E staining (A), PASM staining (B) and PAS staining (C) of kidney sections among three groups (×200) (n=6). (D–F) Relative quantification of the mesangial expansion (D), renal tubular injury area (%) (E) and renal tubular injury score (F) in the kidney among three groups. (G) The mRNA expression of Fabp1, Kim-1, Ngal and Sglt2 in kidney tissues among three groups (n=10). (H) Urine KIM-1 levels among three groups (n=10). (I) The mRNA expression of Fabp1, Kim-1, Ngal and Sglt2 in mTEC cells among three groups (n=10). (J) Sirius Red staining of kidney sections among three groups (×200) (n=3). (K) Collagen fiber area (%) among three groups (n=6). (L) The mRNA expression of Col1a1, Col3a1 and Fn1 in kidney tissues among three groups (n=10). Data are expressed as mean ± SD, *P<0.05, **P<0.01 vs control group; #P<0.05, ##P<0.01 vs DKD group.
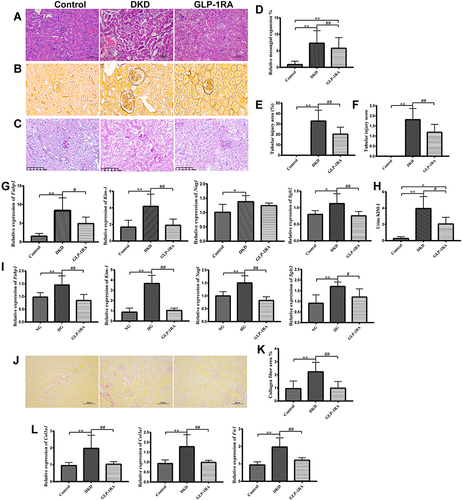
Figure 3 Identification of significant differentially expressed proteins (DEPs) in kidney of mice among three groups by LFQ-based proteomic analysis. (A) Venn diagram for overlapping proteins of the kidney among three groups (n=3). (B) Heatmap for the comparison of the DEPs among three groups (n=3). Red represents significantly up-regulated proteins, blue represents significantly down-regulated proteins, and gray represents no protein quantitative information. (C) The protein expression levels of SVS6, CPT2, APOA1, CSTT1, MUP20, and NAMPT in the kidney of mice among three groups were measured by proteomics analysis (n=3). Data are expressed as mean ± SD, *P<0.05, **P<0.01 vs control group; #P<0.05, ##P<0.01 vs DKD group.
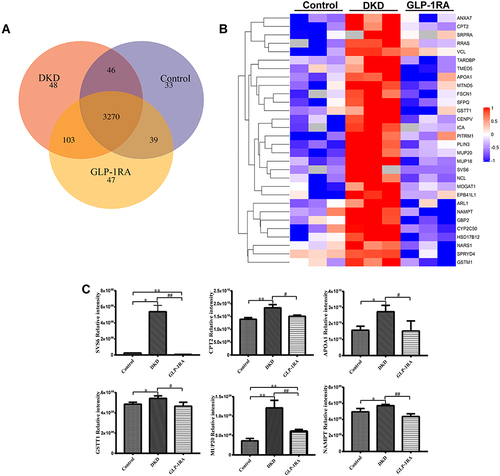
Figure 4 Validation of DEPs by qPCR in vivo and in vitro. (A) The mRNA expression of Svs6, Cpt2, Apoa1, Cstt1, Mup20, and Nampt in the kidney of mice among three groups was measured by qPCR (n = 10). (B) The mRNA expression of Svs6, Cpt2, Apoa1, Cstt1, Mup20, and Nampt in mTEC cells among three groups was measured by qPCR (n = 10). (C) The mRNA expression of Svs6 in mTEC cells after transfection with si-SVS6 by qPCR (n=10). (D) The mRNA expression of Kim-1, Ngal and Sglt2 in mTEC cells among NG group, HG group, GLP-1RA group and HG+si-SVS6 group (n=10). Data are expressed as mean ± SD, *P<0.05, **P<0.01 vs control group; #P<0.05, ##P<0.01 vs DKD group or HG group.
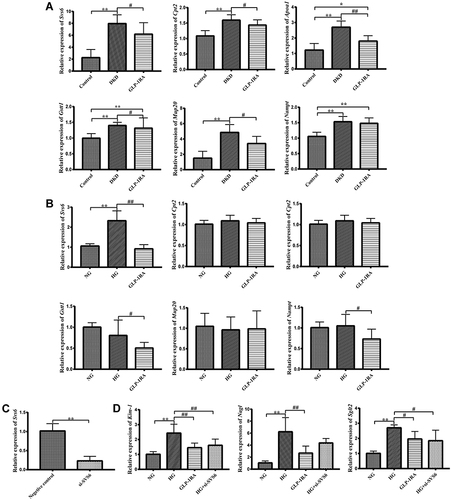
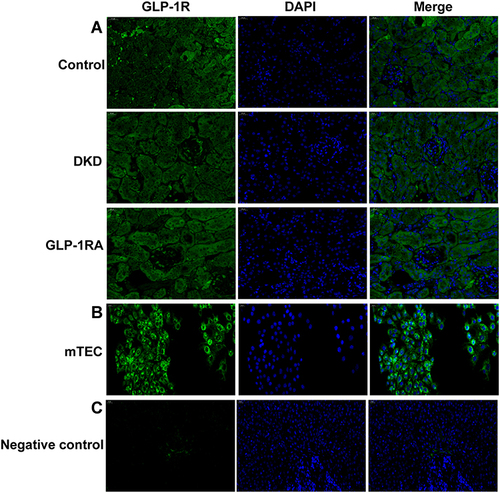
Figure 5 GLP-1R is widely expressed in renal tubules of mice and mTEC cells. (A) Immunofluorescence staining of GLP-1R (green) was performed on the kidney sections of mice in the three groups (n = 3) (400×). (B) Immunofluorescence staining of GLP-1R (green) was performed on the mTEC cells (n = 3) (200×). (C) Immunofluorescence staining of GLP-1R (green) was performed on the ovary sections of mice as a negative control (n = 3) (400×).