Figures & data
Table 1 Clinical Features and Biochemical Profile of Patients with T2D According to Anti-Hyperglycemic Therapy
Table 2 Nutrient Intakes of T2D Patients According to Anti-Hyperglycemic Therapy
Table 3 SLC22A1/OCT1 (rs628031) Genotype and Allele Distribution Among Patients with T2D According of the Glycemic and Type of Anti-Hyperglycemic Therapy
Table 4 Clinical Features and Biochemical Profile of T2D Patients According to Alleles of Met408Val (rs628031) SLC22A1/OCT1 Polymorphism in Monotherapy with Metformin
Table 5 Nutrient Intake of T2D Patients According to Alleles of the SLC22A1/OCT1 (rs628031) Polymorphism in Monotherapy with Metformin
Figure 1 Interaction and correlation between dietary calcium and OCT1 polymorphism regarding HbA1c. (A) Interaction between dietary calcium and OCT1 polymorphism regarding HbA1c values. (B) Correlation between dietary calcium and HbA1c values within risk allele A carriers + metformin monotherapy adjusted by age, sex and energy intake.
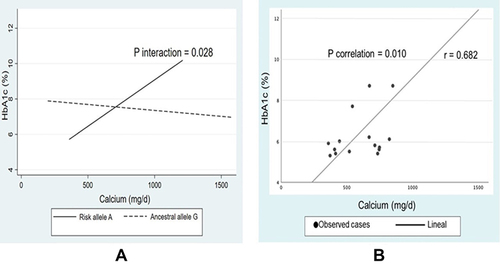
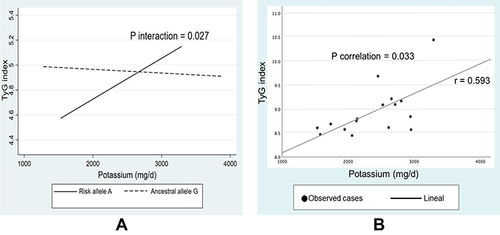
Figure 2 Interaction and correlation between dietary potassium and OCT1 polymorphism regarding the TyG index. (A) Interaction between dietary Potassium and OCT1 polymorphism regarding the TyG index values. (B) Correlation between dietary potassium and TyG index values within risk allele A carriers + metformin monotherapy, adjusted by age, s ex and energy intake.