Figures & data
Table 1 Sequences of Primers for RT-PCR
Figure 1 Cell modeling was set based on the viable cells and the cells’ abilities of metabolism (abilities to consume the glucose). (A) The viability of cells treated with high-glucose (HG) was evaluated by MTT assay. (B) The abilities of metabolism measured by the reduction of glucose concentration in cell mediums at each time points (24h,48h,72h). Compared with control group,*P < 0.05, &P < 0.01, $P < 0.001, #P < 0.0001.
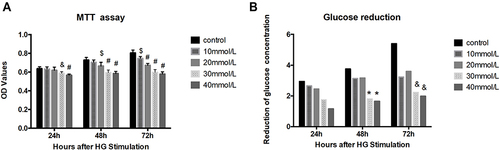
Figure 2 Cultured cells from control group, HG group and DAPT+HG group were harvested for mRNA and protein analyse. (A) RT-PCR showed the increased gene expression of Dll4, Notch1 and VEGF induced under HG stimulation, and Notch4 was expressed lower than that in control group. With DAPT interference, the results were reversed.The relative gene expression was normalized to β-actin. (B and C) The proteins from cells as described in A were collected for Western blot assay. Proteins expression showed the same results as the indicated gene expression in (A). Compared with control group, *P < 0.05, ** P < 0.01, *** P < 0.001.
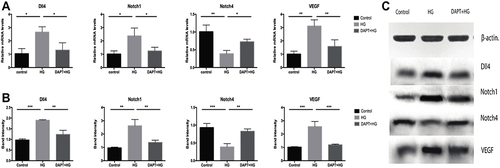
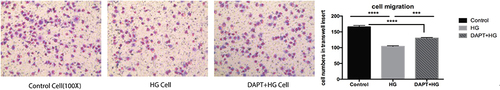
Figure 3 Representative images taken from transwell chambers displayed the cell migration in control group, HG group and DAPT+HG group, from left to right, respectively. Compared with control group, fewer cells were observed in both HG group and DAPT+HG group, which indicated that cell migration was significantly induced by HG stimulation. Compared with HG group, more cells remained in transwell chamber in DAPT+HG group. *** P < 0.001, **** P < 0.0001.