Figures & data
Table 1 Effect of Diosgenin on the Body Weight, at the Start and the End of the Experiment
Table 2 Effect of Diosgenin on Pro-Inflammatory Cytokines TNF-Alpha and IL-6 in Mice
Table 3 Effect of Diosgenin on Malondialdehyde (MDA) and Total Antioxidant Capacity (TAC) in Mice
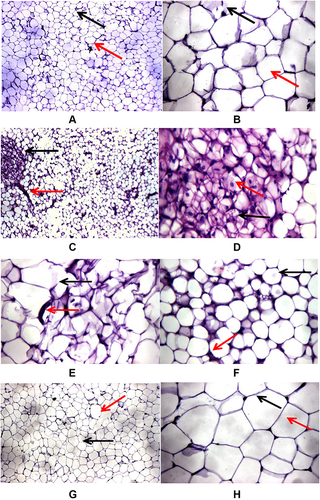
Figure 1 Effects of DG on HFD-induced histopathological changes in adipose tissues of mice. (A) and (B) Adipose tissue section from the control: (A) adipose tissue showing average uni-vacuolated adult fat cells (black arrow) with average extracellular matrix (red arrow), (B) high-power view showing uni-vacuolated adult fat cells with compressed nucleus at one side (black arrow) with intact cell membrane (red arrow). (C–E) and (F) Adipose tissue sections from the HFD group: (C) adipose tissue showing closely packed variable-sized fat cells (black arrow) with fibrous connective tissue bands (red arrow), (D) high-power view showing closely packed overcrowded small-sized fat cells with multiple vacuoles (black arrow) with centrally located nuclei (red arrow), (E) adipose tissue showing ruptured fat cells (black arrow) with fibrous connective tissue bands (red arrow), (F) another view showing closely packed overcrowded small-sized fat cells (black arrow) with excess connective tissue (red arrow). (G) and (H) Adipose tissue sections from the HFD + DG group: (G) adipose tissue showing average uni-vacuolated adult fat cells (black arrow) with average extracellular matrix (red arrow), (H) high-power view showing univacuolated fat cells with compressed nucleus at one side (black arrow) and intact cell membrane (red arrow).