Figures & data
Table 1 Demographic and Clinical Characteristics of Subjects
Table 2 Distribution of Thyroid Status
Table 3 Correlation Between Thyroid Function and Demographic and Metabolic Parameters
Table 4 Multivariate Analysis of Associated Factors of Diabetic Nephropathy in Patients with Newly Diagnosed T2DM
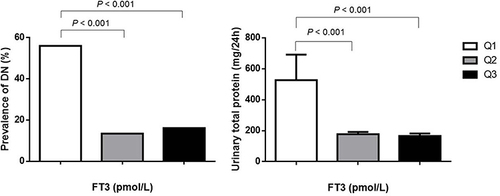
Figure 1 Prevalence of DN and levels of urinary total protein in different FT3 quartiles. Quartile 1 (Q1, n = 109), 1.54 to < 3.26 pmol/L; Quartile 2 (Q2, n = 119), 3.26 to < 3.88 pmol/L; Quartile 3 (Q3, n = 112), 3.88 to ≤ 7.18 pmol/L.
Abbreviations: DN, diabetic nephropathy; FT3, free triiodothyronine.