Figures & data
Table 1 Baseline Characteristics of Diabetes and Non-Diabetes Groups
Table 2 Cox Regression Analyses for the Association Between the Non-High-Density Lipoprotein Cholesterol to High-Density Lipoprotein Cholesterol Ratio and Incident Diabetes in Different Models
Figure 1 Hazard ratios (95% confidence intervals) for the non-linear relationship between NHHR and the risk of diabetes.
Abbreviation: NHHR, non-high-density lipoprotein cholesterol to high-density lipoprotein cholesterol ratio.
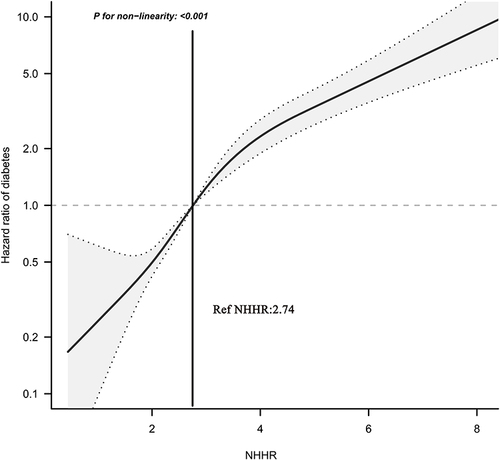
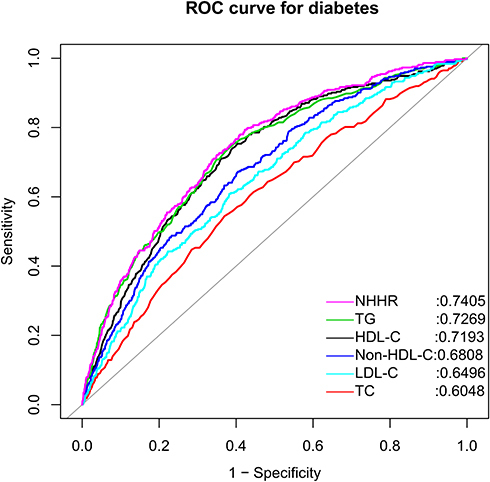
Table 3 Areas Under the Receiver Operating Characteristic Curves for Each Lipid Parameter in Identifying Diabetes
Figure 2 Receiver operating characteristic curve analysis of diabetes-related lipid parameters.
Abbreviations: NHHR, non-high-density lipoprotein cholesterol to high-density lipoprotein cholesterol ratio; HDL-C, high-density lipoprotein cholesterol; non-HDL-C, non-high-density lipoprotein cholesterol; TC, total cholesterol; TG, triglyceride; LDL-C, low-density lipoprotein cholesterol.