
Figures & data
Figure 1 Population selection flow diagram.
Notes: Infection was defined as pneumonia, bacteremia, sepsis or unknown causes with white blood cell (WBC)> 15×109/L and procalcitonin (PCT) >2.5 ng/mL. Hepatic insufficiency was defined as alanine aminotransferase (ALT) and aspartate aminotransferase (AST) > 3 times of upper limit of normal (ULN) value.
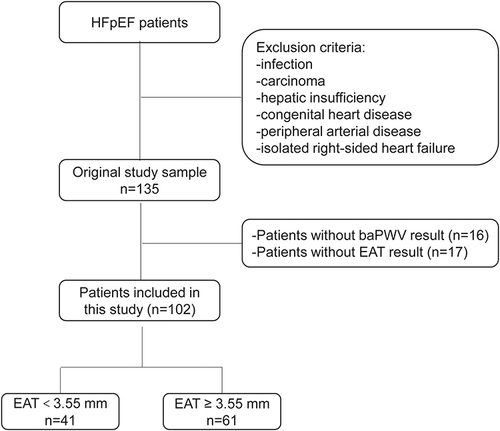
Figure 2 Ultrasound diagnostic apparatus assessment of epicardial adipose tissue (EAT) which was marked by the red arrow.
Abbreviations: LV, left ventricle; LA, left atrium; AO, aorta; RV, right ventricle.
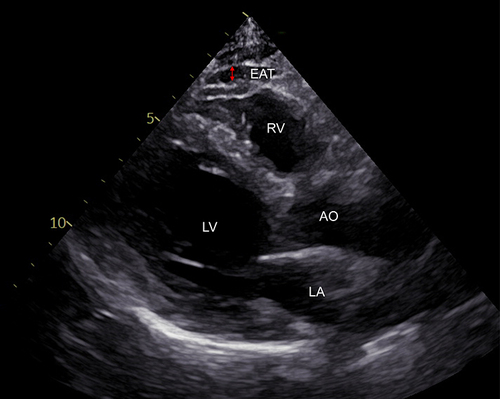
Figure 3 The receiver operating characteristic (ROC) curve of the EAT for predicting arterial stiffness.
Notes: The area under the curve (AUC) for arterial stiffness was 0.759. The best cut-off of EAT thickness to predict arterial stiffness was 3.55 mm with the sensitivity of 67.1% and the specificity of 70.0% (95% CI 0.645-0.873).
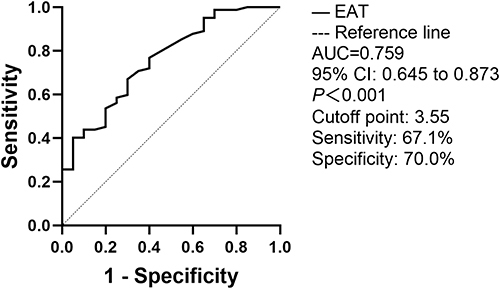
Table 1 Characteristics of the Study Population According to EAT Thickness
Table 2 Correlation Analysis Among Epicardial Fat Thickness, baPWV, and Other Variables
Table 3 Multivariate Linear Regression Analysis for the Effect of Epicardial Fat Thickness on the Absolute Value of baPWV