
Figures & data
Table 1 Comparison of Clinical and Laboratory Characteristics at Baseline and the 12th Month Between Lipid-Lowering Group and Control Group
Figure 1 Decrease trends of transaminases and blood lipids in the lipid-lowering group (n = 325) and control group (n = 216). Repeated-measures analysis of variance (ANOVA) for the comparison of effects on ALT (A), AST (B), GGT (C), total cholesterol (D), triglyceride (E), and LDL-c (F) between lipid-lowering group and control group. P values were for the ANOVA analysis between the two groups.
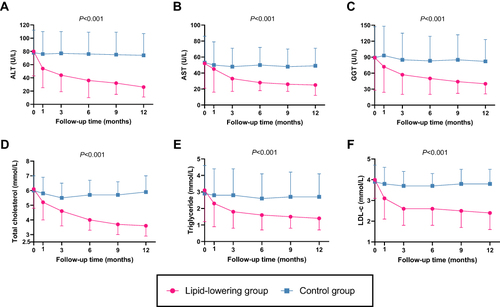
Figure 2 Correlation analysis between changes in transaminase and blood lipids in the lipid-lowering group (n = 325) and control group (n = 216). ***P < 0.001, **P < 0.01. *P < 0.05.
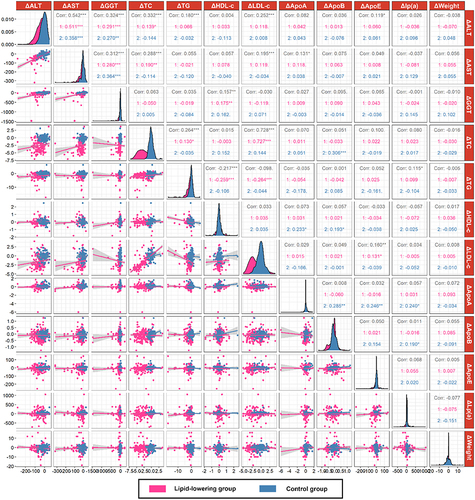
Figure 3 The impact of declining blood lipid levels on transaminase and GGT normalization. Comparison of transaminase and GGT normalization rate between the lipid-lowering group (n = 325) and control group (n = 216) (A), statin group (n = 216) and fibrate group (n = 91) (B and C), MAFLD with T2DM group (n = 67) and without T2DM group (n = 258), the male group (n = 241) and female group (n = 84) (C), and groups of 3 different reduction ranges in blood lipids (G). Comparison of LDL-c (D) and non-HDL-c (E) treated to target rate between the lipid-lowering group and the control group. Comparison of reduction ranges in blood lipids between the transaminase and GGT normalization group (n = 169) and nonnormalized group (n = 156) (F). ***P < 0.001, *P < 0.05.
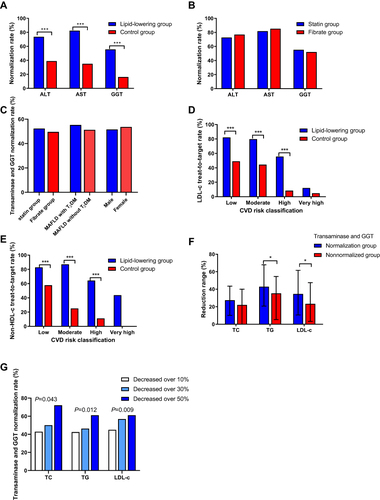
Table 2 Univariate and Multivariate Analyses of Factors Associated with Transaminase and GGT Normalization by Lipid-Lowering Agents