
Figures & data
Figure 1 Diagram of the study design.
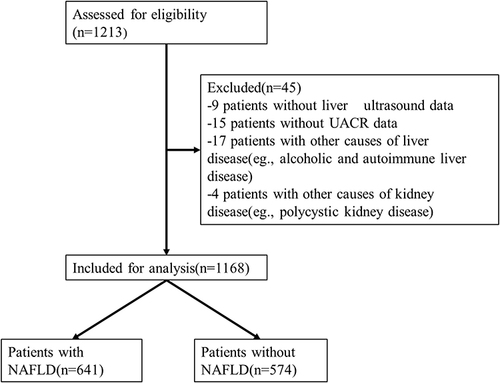
Table 1 Comparison of the Prevalence of NAFLD and the Other Indicators Between CKD and Non-CKD Groups
Figure 2 Comparison of the SCr, UACR, and eGFR levels between the NAFLD and non-NAFLD groups. (A) SCr level, (B) eGFR level, (C) UACR level.
Abbreviations: SCr, serum creatinine; eGFR, estimated glomerular filtration rate; UACR, urinary albumin creatinine ratio; NAFLD, non-alcoholic fatty liver disease.
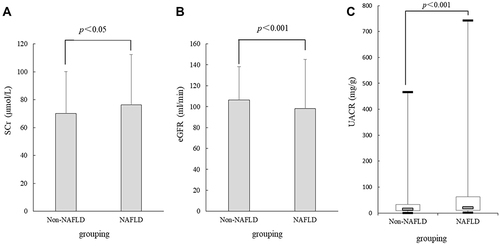
Figure 3 Comparison of the prevalence of NAFLD in the different UACR level groups or eGFR level groups. (A) The prevalence of NAFLD in different UACR levels groups, (B) the prevalence of NAFLD in different eGFR levels groups.
Abbreviations: eGFR, estimated glomerular filtration rate; UACR, urinary albumin creatinine ratio; NAFLD, non-alcoholic fatty liver disease.
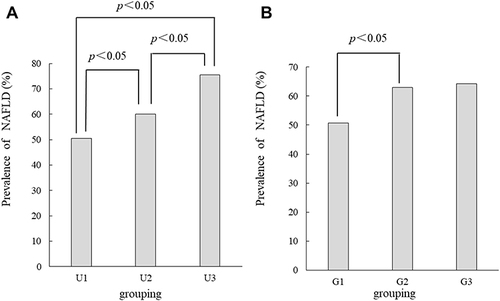
Table 2 Correlation Between NAFLD and CKD in T2DM Patients by Univariate Logistic Regression Analysis
Table 3 Risk Analysis of NAFLD in the Different UACR Levels by Stratified Logistic Regression Analysis