Figures & data
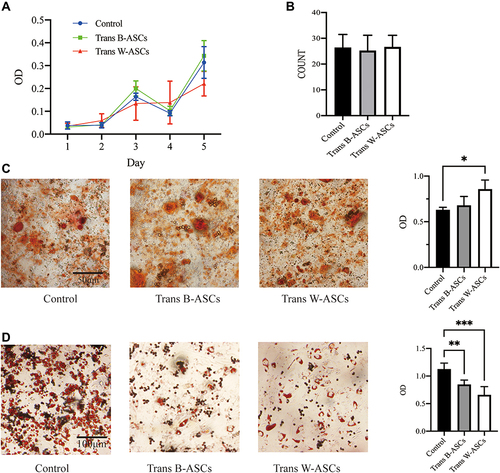
Figure 5 Effects of B-ASC and W-ASC transplantation on the plasticity of abdominal ASCs. (A) MTT assay of cell proliferation. (B) Colony count. (C) Osteogenic differentiation. (D) Adipogenic differentiation. Data are means ± standard deviation (n = 5). Statistical analysis was conducted with GraphPad Prism 9. *P < 0.05; **P < 0.01; and ***P < 0.001.