
Figures & data
Figure 1 Showing the finger ridge count for different patterns. Red line indicating finger ridge count of loop pattern, Maroon lines indicating finger ridge count of whorl pattern with two triradii there are two counts and the higher is used.
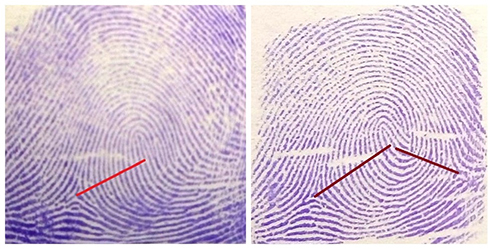
Figure 2 Showing the atd angles of the left palm Gedeo Zone governmental hospitals, Southern Ethiopia.
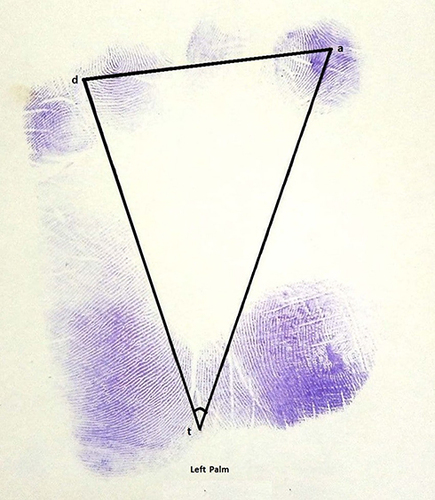
Table 1 Frequency Distribution of Socio-Demographic Characteristics of Type 2 DM Patients and Non-Diabetic Patients in Gedeo Zone Public Hospitals, Southern Ethiopia
Figure 3 Frequency distribution of finger print pattern among type 2 diabetic and non-diabetic patients Gedeo Zone governmental hospitals, Southern Ethiopia.
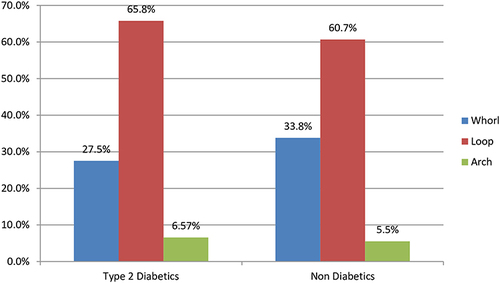
Figure 4 Different finger print patterns of study participants Gedeo Zone governmental hospitals, Southern Ethiopia.
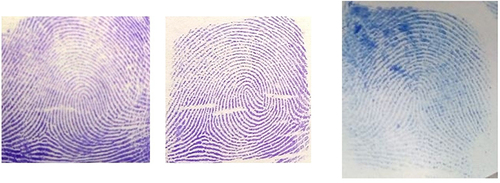
Table 2 Prevalence and Chi-Square Test of the Dermatoglyphics Pattern of Both Male and Female in Diabetic and Controls
Table 3 Prevalence and Chi-Square Test of the Dermatoglyphics Pattern of Both Hands in Diabetic and Controls
Table 4 Prevalence and Chi-Square Test of Symmetryness with Dermatoglyphics Pattern Among Type 2 DM Patients and Non-Diabetic Patient
Figure 5 Palm print of the right hand showing atd angle in Gedeo Zone governmental hospitals, Southern Ethiopia.
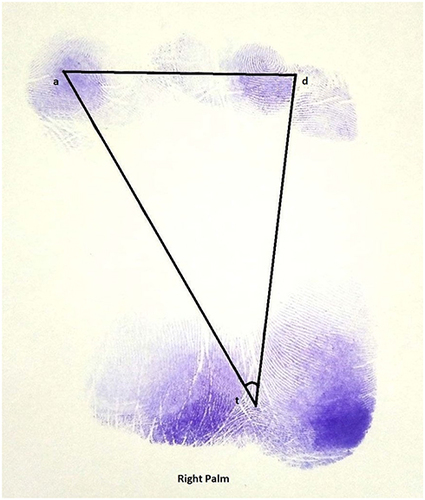
Table 5 Comparison of Atd Angle, TFRC and AFRC Among Type 2 Diabetes and Non-Diabetes Mellitus Patient
Table 6 Bivariable and Multivariable Analysis of Multinomial Logistic Regression of Associated Factors with Digital Dermatoglyphics Pattern of Public Hospitals in Gedeo Zone