
Figures & data
Table 1 Clinical and Laboratory Characteristics of Lean, Overweight and Obese Subjects
Table 2 Clinical and Laboratory Characteristics of Subjects with Different Degrees of LiSA
Table 3 Spearman Correlation Analysis of Factors Associated with LiSA in Lean, Overweight and Obese Subjects
Figure 1 (A–J) Scatter plot showing significant Spearman correlation between LiSA and clinical indicators. (K) Histogram of residuals for the linear regression model. (L) Normal probability plot of regression standardized residual for the linear regression model.
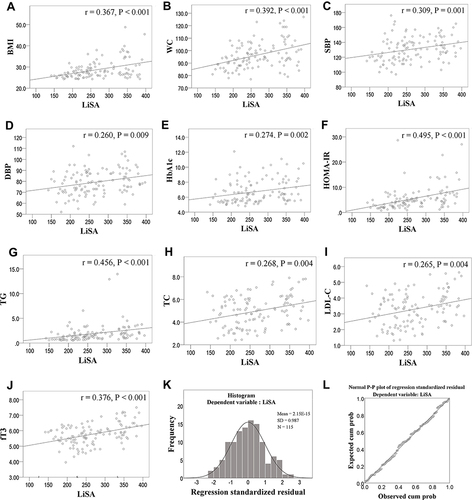
Table 4 Stepwise Multiple Linear Regression Analyses of Variables Associated with LiSA in Overweight and Obese Subjects