Figures & data
Figure 1 Schematic illustration of a typical metabolomic pipeline.
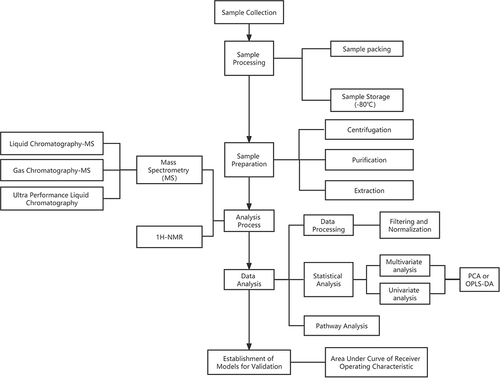
Table 1 Summary of Antibody Production and Metabolite Changes
Figure 2 Speculation on the progress of T1DM from the perspective of metabolomics. When the body enters the abnormal metabolic state (ie serum transformation period) due to various factors, the body will not immediately appear disease characteristics, but take the lead in self-regulation to restore the metabolic state to relatively normal, but the subsequent cost is to reduce the onset threshold (shown by the dotted line in the figure). After that, when the risk factors reappear again, due to the reduction of the incidence threshold, the metabolic state of the body will progress to the abnormal level at a faster speed, even more serious than the first time (ie disease state). The disease threshold of the body had decreased after the first self-metabolic regulation. The red box represented more severe pathogenic intensity.
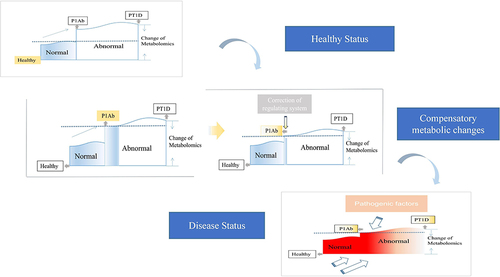
Table 2 Summary of the Age-Specific Metabolites
Figure 3 Schematic representation of the metabolic pathways in in the events of DN and T1DM.
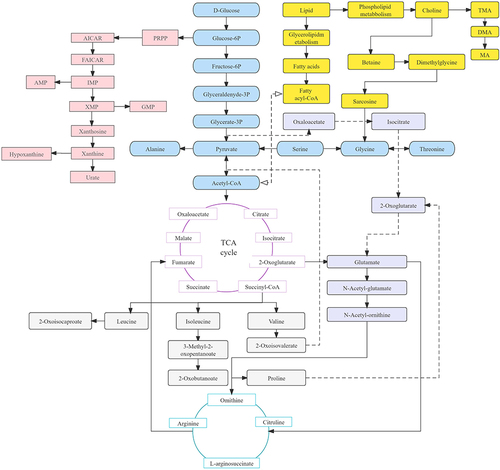
Figure 4 Metabolic pathways involved in the pathogenesis of DN. Star symbols represented potential therapeutic targets; ↑ or ↓ indicated the upward or downward trend of corresponding analytes.
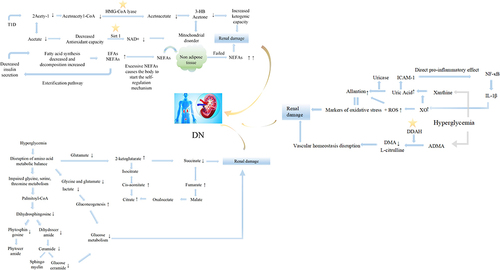
Table 3 Summary of Changes in Metabolites of DN
Figure 5 Metabolic pathways involved in the pathogenesis of DR. The purple box represented sorbitol.
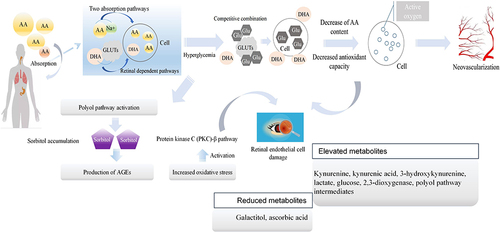
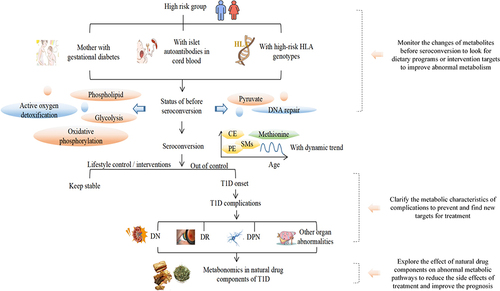
Figure 6 The diagram on the T1D progress in metabolomics.