
Figures & data
Table 1 Baseline Characteristics of Participants in the Two Groups
Table 2 Multivariate Logistic Regression Analysis for the Risk of DFU
Table 3 Comparison of 25-OH-Vitamin D Nutrition Status Between Non-DFU Group and DFU Group
Figure 1 Bar Graphs Show the Serum 25-OH-vitamin D Levels Among Patients with DFU with Different Wagner Grades.
Notes: Post-hoc multiple comparisons revealed that 25-OH-vitamin D levels of Wager Grades 1 and 2 were significantly higher than Wager Grade 4. Plots are drawn from the median and 95% CI (*P<0.05, **P<0.01).
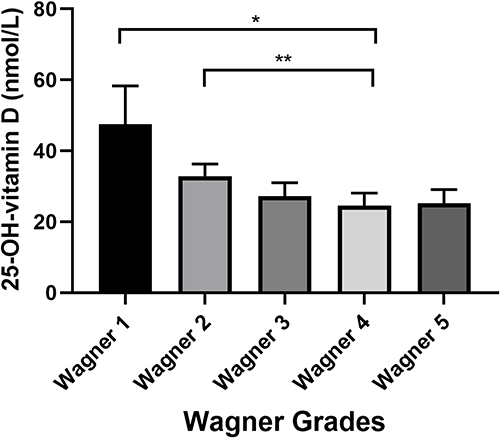
Table 4 The Correlation Between 25-OH-Vitamin D and Clinical Parameters in DM Patients