
Figures & data
Table 1 The Effects of Exercise Training, Genistein, and Combined Exercise and Genistein on Basic Physical Characteristics and Caloric Intake
Table 2 The Effects of Exercise Training, Genistein, and Combined Exercise and Genistein on Serum Profile
Figure 1 Effects of 12 weeks of genistein treatment, exercise training, and combined treatment on glucose tolerance. (A) Glucose tolerance tests, GTTs, were performed in overnight fasted mice at week 11 of the study. Following an intraperitoneal bolus of glucose (2 mg/g body weight), glucose readings were obtained from the tail vein at time 15, 30, 60, and 120 minutes. Excursions in blood glucose for 120 minutes following bolus of glucose. (B) Average area under the curve (AUC) calculated from the GTT data shown in 1A. Values are reported as mean ± SEM for 4–5 mice in each group. *Significant difference from lean control mice, #Significant treatment effect, P < 0.05.
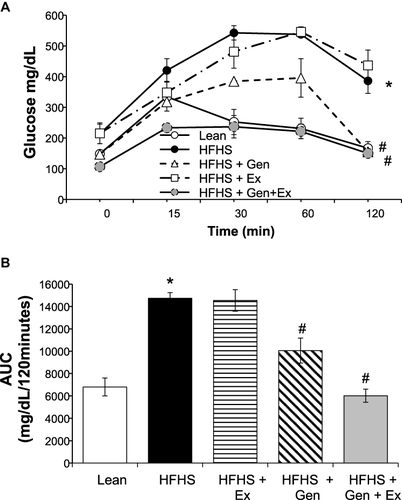
Figure 2 Effects of 12 weeks of genistein treatment, exercise training, and combined treatment on hepatic steatosis. (A) Representative histology liver sections stained with Oil Red O staining. Images are at 20x magnification and scale bar is 50 µm. (B) Average fat droplet size in liver. (C) Average fat area in liver per given area evaluated. (D) Serum alanine aminotransferase, ALT, a marker for hepatic injury. Values are reported as mean ± SEM for 7–10 mice in each group. *Significant difference from lean control mice, #Significant treatment effect, P < 0.05.
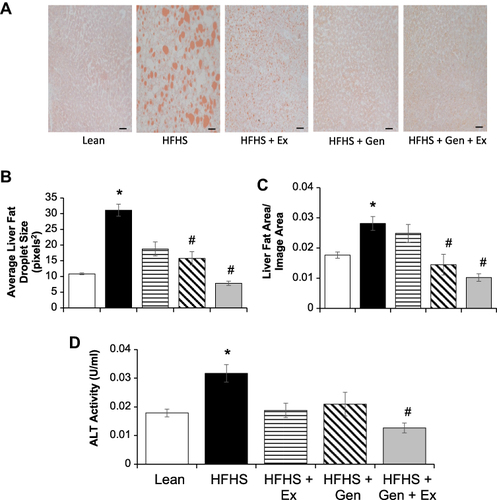
Figure 3 Effects of 12 weeks of genistein treatment, exercise training, and combined treatment on expression of key hepatic and gastrocnemius proteins. (A) Expression of carnitine palmitoyl transferase, CPT1b, in gastrocnemius. (B) Expression of GLUT4 in gastrocnemius. (C) Expression of glucose transporter protein, GLUT2, in liver. (D) Expression of glucocorticoid receptor, GR, in liver. (E) Expression of fructose-1,6-bisphosphate, FBP1, in liver. Protein expression was determined by Western blot analysis. Protein expression was normalized using either GAPDH or actin as the housekeeping gene. (F) Fecal corticosterone level. Fecal matter was collected from mice at the end of the study for the measurement of corticosterone levels (n = 7–8 samples/group). Values are reported as mean ± SEM for 2–3 independent experiments for each protein of interest performed on 4–8 samples per group. *Significant difference from lean, #Significant treatment effect, P < 0.05.
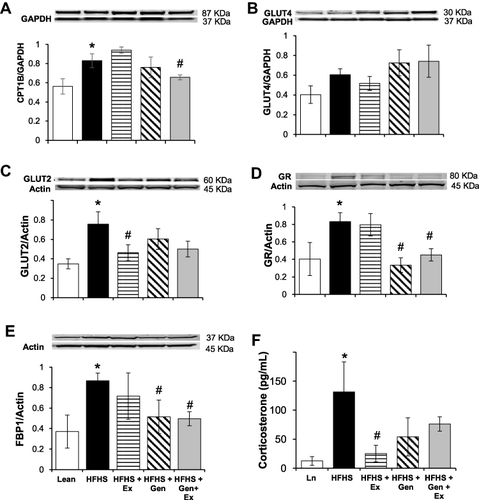
Figure 4 Effects of 12 weeks of genistein treatment, exercise training, and combined treatment on the expression of key hepatic proteins relating to fatty acid metabolism. (A) Expression of acetyl-CoA carboxylase, ACC1, in liver. (B) Expression of carnitine palmitoyl transferase, CPT1a, in liver. (C) Expression of fatty acid synthase, FAS, in liver. Protein expression was determined by Western blot analysis. Protein expression was normalized to actin. Values are reported as mean ± SEM for 2–3 independent experiments for each protein of interest performed on 4–8 samples per group. *Significant difference from lean, #Significant treatment effect, P < 0.05.
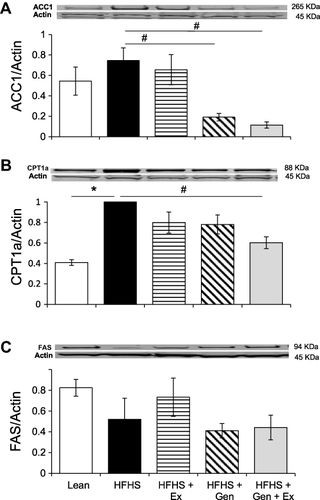
Table 3 Summary of the Effects of HFHS Feeding and Treatment on Physical Characteristics, Liver Histology, Serum and Protein Profiles Relating to the Development of MAFDL in Mice