Figures & data
Table 1 Characteristics of Study Participants
Table 2 Univariate and Multivariate Analyses for Associations Between Body Composition and BMD Value at Various Skeletal Sites for Females and Males
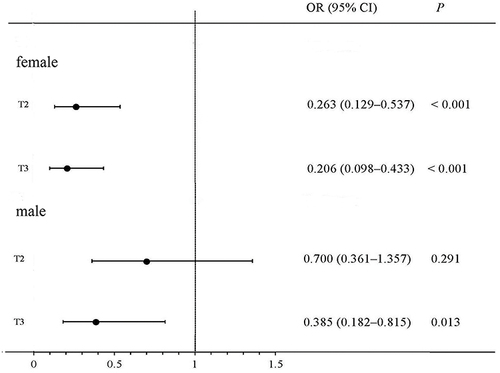
Figure 1 Comparison of leg fat mass between normal bone mineral density, osteopenia, and osteoporosis in different waist circumference groups. (A) Comparison of leg fat mass in females; (B) comparison of leg fat mass in males. *P<0.05 versus normal bone mineral density, **P<0.001 versus normal bone mineral density.
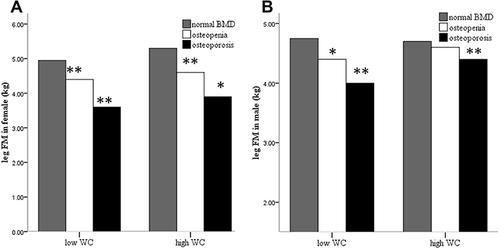
Figure 2 Adjusted odds ratio of osteoporosis according to tertiles of leg fat mass. The odds ratio with corresponding 95% confidence interval were adjusted for age, lifestyles (intake of fish, smoking, alcohol), glucose and lipid metabolism indexes (HbA1c, HOMA-IR, TG, HDL-c, LDL-c), diabetes duration, and total lean mass. T1 is the reference group.