Figures & data
Figure 1 Mild steatosis (S1) bright liver with discrete posterior attenuation.
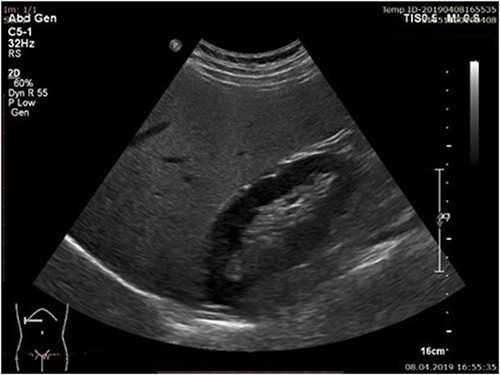
Figure 2 Moderate steatosis (S2) bright liver with obvious posterior attenuation.
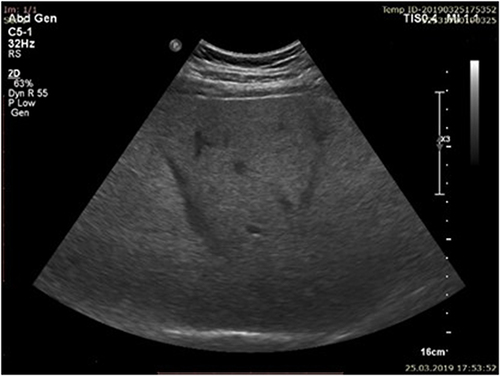
Figure 3 Severe steatosis (S3) bright liver with intense posterior.
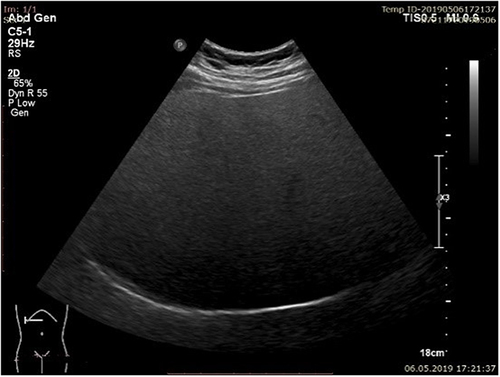
Table 1 Baseline Characteristics of the Study Group
Table 2 Logistic Regression for Predicting Liver Fibrosis (>8.2kpa)
Table 3 Ultrasound Liver Steatosis Accuracy versus CAP Assessment
Table 4 Hepatic Fibrosis Score (HFS)
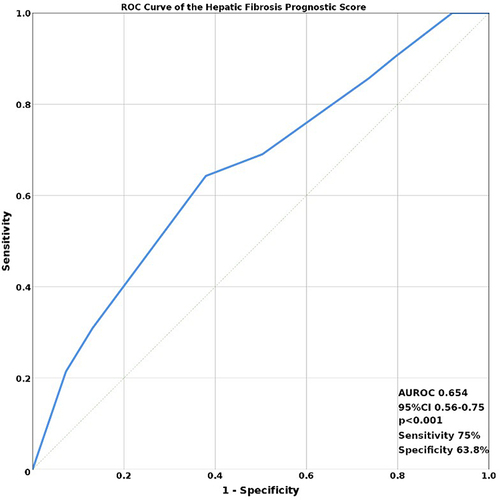
Figure 4 ROC curve of hepatic fibrosis score.
Abbreviations: AUROC, Area Under the Receiver Operating Characteristic; CI, Confidence Interval.