Figures & data
Figure 1 Effect of miR-138 on the histological changes of skin ulcer model in rats. (A) The expression of miR-138 mRNA in different groups. (B) The morphological changes of foot ulceration in different groups (×200). **p < 0.01 against Control group; ##p < 0.01 against DFU group; ^^p < 0.01 against NC group; &&p < 0.01 against miR-138 inhibitor group; $$p < 0.01 against IGF-1 group.
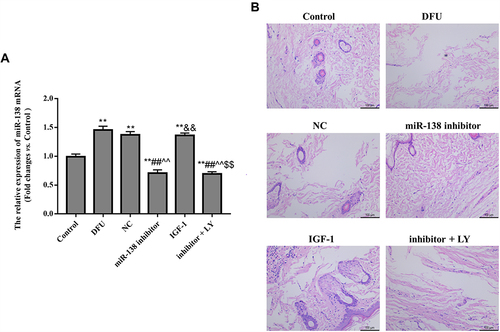
Figure 2 Down-regulation of miR-138 alleviates inflammatory response (A) and wound healing ((B), ×200) in DFU rats. *p < 0.05, **p < 0.01 against Control group; #p < 0.05, ##p < 0.01 against DFU group; ^^p < 0.01 against NC group; &p < 0.05, &&p < 0.01 against miR-138 inhibitor group; $p < 0.05, $$p < 0.01 against IGF-1 group.
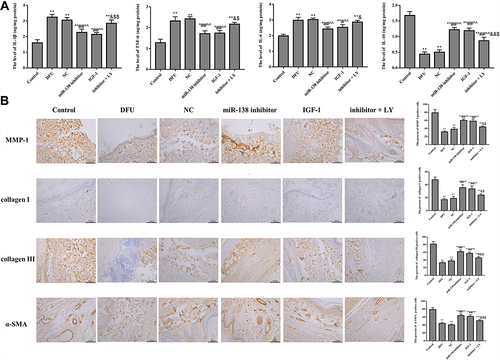
Figure 3 Down-regulation of miR-138 improves blood vessel formation in DFU rats. (A) CD34 immunohistochemical staining was used to evaluate vessel density (×200). (B) Western blot was used to detect the expression of blood vessel formation and PI3K/AKT pathway related proteins. *p < 0.05, **p < 0.01 against Control group; #p < 0.05, ##p < 0.01 against DFU group; ^^p < 0.01 against NC group; &p < 0.05, &&p < 0.01 against miR-138 inhibitor group; $p < 0.05, $$p < 0.01 against IGF-1 group.
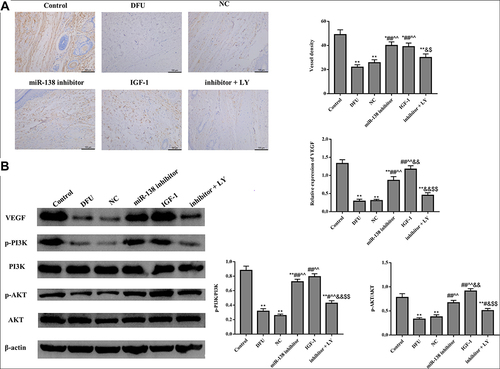
Figure 4 Effect of miR-138 on hTERT. (A) hTERT is a target gene of miR-138. (B) qRT-PCR was used to detect the mRNA expression of miR-138 and hTERT. @@p < 0.01 against miR-NC group. **p < 0.01 against Control group; ##p < 0.01 against HG group; ^p < 0.05, ^^p < 0.01 against NC group; &&p < 0.01 against miR-138 inhibitor group; $$p < 0.01 against IGF-1 group; %%p < 0.01 against inhibitor + LY group.
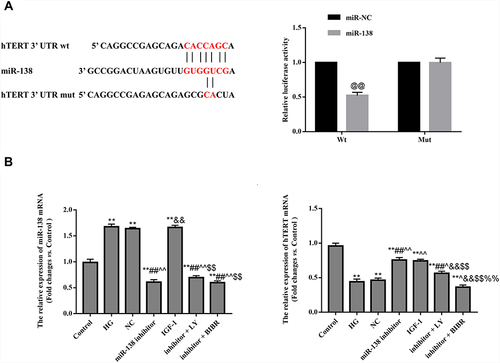
Figure 5 Effect of miR-138 on the cellular bioactivity of HUVECs. (A) CCK-8 assay. (B) Tube formation assay (×200). (C) Transwell assay (×200). *p < 0.05, **p < 0.01 against Control group; #p < 0.05, ##p < 0.01 against HG group; ^p < 0.05, ^^p < 0.01 against NC group; &p < 0.05, &&p < 0.01 against miR-138 inhibitor group; $p < 0.05, $$p < 0.01 against IGF-1 group.
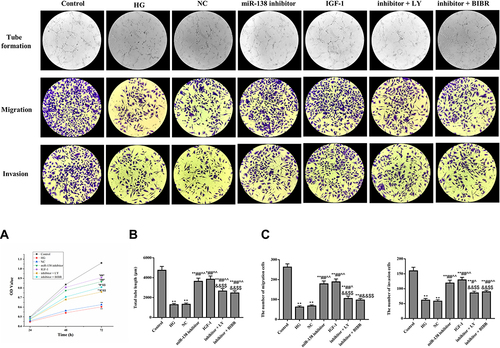
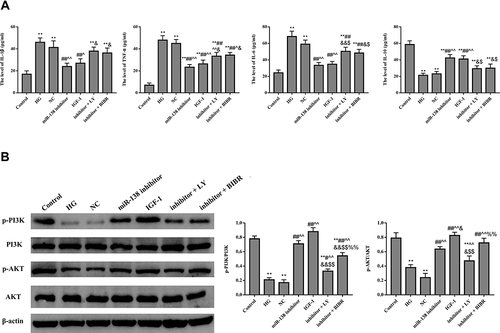
Figure 6 Effect of miR-138 on the content of inflammation (A) and PI3K/AKT pathway (B) related factors in HUVECs. **p < 0.01 against Control group; #p < 0.05, ##p < 0.01 against HG group; ^p < 0.05, ^^p < 0.01 against NC group; &p < 0.05, &&p < 0.01 against miR-138 inhibitor group; $p < 0.05, $$p < 0.01 against IGF-1 group, %%p < 0.01 against inhibitor + LY group.