
Figures & data
Figure 1 A final group creation process. The total number of exclusions is not equal to the sum of patients excluded by each criteria because one patient may have been excluded for more than one reason.
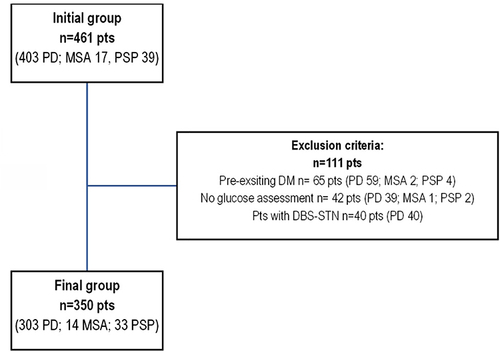
Table 1 Demographic and Clinical of a Final Analyzed Group Broken Down by Diagnosis. Kruskal–Wallis Test for Quantitative Variables and Fisher’s Exact Test for Qualitative Variables
Table 2 Laboratory Characteristic of a Final Analyzed Group Broken Down by Diagnosis. Kruskal–Wallis Test for Quantitative Variables and Fisher’s Exact Test for Qualitative Variables
Table 3 Demographic and Clinical Characteristic of a PD Patients Group Broken Down by Gender. U-Mann–Whitney Test for Quantitative Variables and Fisher’s Exact Test for Qualitative Variables
Table 4 Laboratory Characteristic of a PD Patients Group Broken Down by Gender. U-Mann–Whitney Test for Quantitative Variables and Fisher’s Exact Test for Qualitative Variables