Figures & data
Table 1 Sequences of Primers for qRT-PCR
Figure 1 GO and KEGG pathway analysis of DEGs in hearts from normal and diabetic rats. Genes altered at 42 days after diabetes induction were obtained by statistical reanalysis of the GSE4745 data. (A) Volcano plot of expression data from diabetic hearts and normal ones 42 days after diabetes induction in GSE4745. (B) Meandiff plot of expression data from diabetic hearts and normal ones 42 days after diabetes induction in GSE4745. (C) GO analysis of DEGs between diabetic hearts and normal ones. The x-axis of GO analysis is the three basic terms (biological process, cellular component, and molecular function), the y-axis is the ratio of the number of differential genes enriched in the term to the total number of genes in the Go term. (D) KEGG pathway analysis of DEGs between diabetic hearts and normal ones. In bubble diagrams, the y-axis shows the name of the KEGG pathway, and the enrichment on the x-axis denotes the p-value. The dot’s colordot represents the p-value, and the size of the dot represents the exact number of DEGs mapped to this pathway.
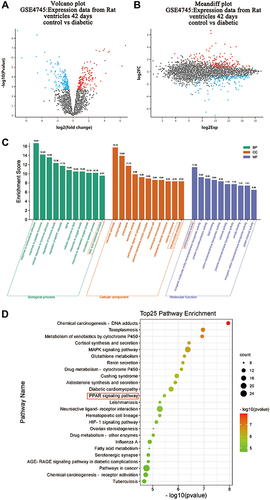
Figure 2 PA caused low viability and severe lipid accumulation in cardiomyocytes. (A) MCMs treated with various concentrations (0, 150, 350, 450, 550 μM) of PA for 24 h. Cell viability was detected by CCK-8. (B) Cell morphological changes were assessed after PA (0, 150, 350 μM) stimulated MCMs for 24 h (Scale bars = 500 μm). (C) Oil red O staining was assessed with the Olympus light microscope after PA (0, 150, 350 μM) stimulated MCMs for 24 h (Scale bar = 50 μm). (D) Quantified relative area of positive oil red O staining (%Area) in cardiomyocytes (measured by Image J). (E) The mRNA levels of CD36 after being treated PA (0, 150, 350 μM) in cardiomyocytes. **P < 0.01, ****P < 0.0001 vs control or 0 μM PA, #P < 0.05, ####P < 0.0001 vs 150 μM PA.
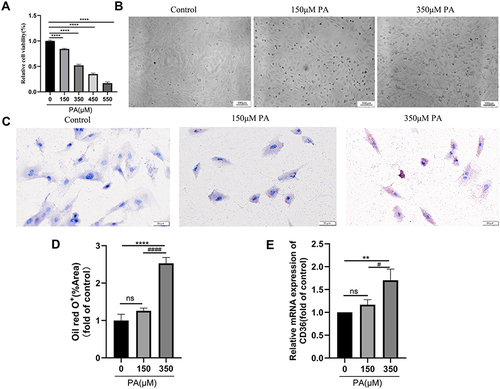
Figure 3 PA increased ROS levels, decreased ATP production and damaged mitochondria in cardiomyocytes. (A) Cellular ROS levels were assessed by DCF in cells after treatment with PA (0, 150, 350 μM) for 24 h (Scale bar = 500 μm). (B) Quantified cell ROS levels in cardiomyocytes (measured by Image J). (C) After MCMs were treated with PA (0, 150, 350 μM) for different times, cellular ATP levels were measured. (D) PA induced the morphological changes of mitochondrial in cardiomyocytes detected by TEM. MCMs were treated with PA (0, 150, 350 μM) for 24 h (Scale bars = 250 nm). Blue arrows indicate normal mitochondria, red arrows indicate abnormal mitochondria. *P < 0.05, **P < 0.01, ****P < 0.0001 vs control or 0 μM PA, #P < 0.05, ####P < 0.0001 vs 150 μM PA.
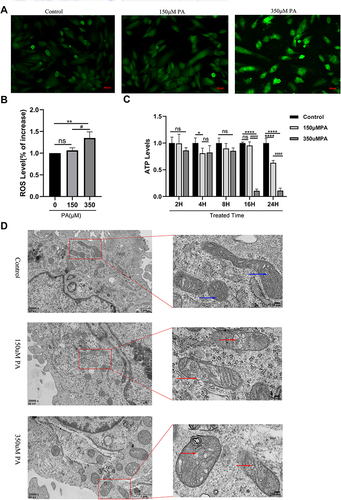
Figure 4 PPARα and PPARγ were down-regulated in the PA-stimulated cardiomyocytes. (A and B) The protein levels of PPARα and PPARγ in cardiomyocytes stimulated with various concentrations of PA (0, 150, 350 μM) for 24 h. The protein expression of GAPDH was used as standard. (C and D) Quantified protein levels of PPARα and PPARγ in cardiomyocytes (measured by Fusion). (E) Immunofluorescence of PPARγ (red) and DAPI (blue) in cardiomyocytes (Scale bars = 50 μm). (F) Quantified fluorescence intensity of PPARγ in cardiomyocytes (measured by Image J). *P < 0.05, ***P < 0.001, ****P < 0.0001 vs the control or 0 μM PA, #P < 0.05, ##P < 0.01, ###P < 0.001 vs the 150μM PA.
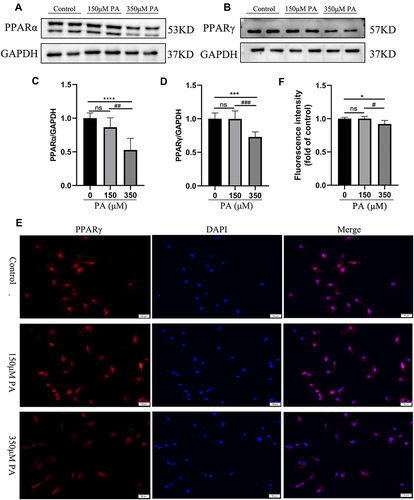
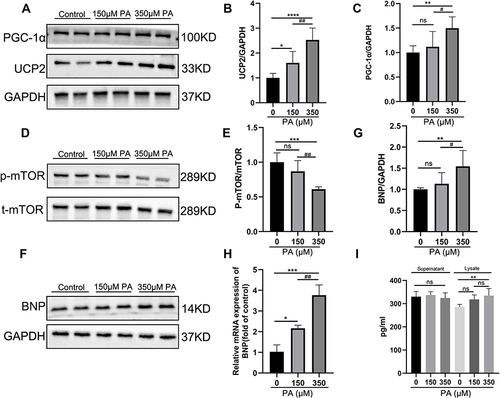
Figure 5 P-mTOR was decreased, and PGC-1α-UCP2-BNP was increased in PA-inducted impaired cardiomyocytes. (A) The protein expression levels of PGC-1α and UCP2 in the MCMs stimulated with PA for 24 h. GAPDH was used as standard. (B and C) Quantified protein levels of PGC-1α and UCP2 (measured by Fusion). (D and E) The protein expression levels of p-mTOR and mTOR were analyzed after PA (0, 150, 350 μM) stimulated MCMs for 24 h. (F and G) The protein expression levels of BNP were analyzed by Western blotting, and GAPDH was used as standard. (H) The mRNA levels of the cell damage marker gene BNP after being treated with PA in cardiomyocytes. (I) BNP content in cell supernatant and lysate was measured by ELISA Kit. *P < 0.05, **P < 0.01, ***P < 0.001, ****P < 0.0001 vs the control or 0 μM PA, #P < 0.05, ##P < 0.01 vs the 150 μM PA group.