237
Views
1
CrossRef citations to date
0
Altmetric
ORIGINAL RESEARCH

Hyperferritinemia Correlates to Metabolic Dysregulation and Steatosis in Chinese Biopsy-Proven Nonalcoholic Fatty Liver Disease Patients

, , , , , ORCID Icon, & show all
Pages 1543-1552 | Published online: 17 May 2022

Figures & data

Table 1 The Clinical and Demographic Characteristics of Enrolled NAFLD Patients

Figure 1 The flow chart for patient inclusion.

Figure 1 The flow chart for patient inclusion.

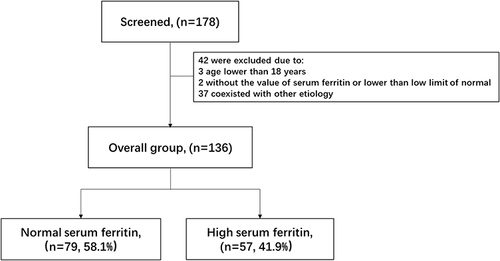
Table 2 The Histopathological Features of Enrolled NAFLD Patients

Figure 2 The relationship of serum ferritin levels and the liver histopathology. (A) Steatosis stage 1 vs 2–3, (B) inflammation activity from 1 to 4 points, (C) fibrosis stage from 1 to 4, (D) negative vs positive Perl’s staining. The value within the box ranges from the 25th to the 75th percentiles. The median is shown by the horizontal bar. The vertical bars represent the values between the minimum and the maximum. The * Indicates as p < 0.05 while *** as p < 0.001.

Figure 2 The relationship of serum ferritin levels and the liver histopathology. (A) Steatosis stage 1 vs 2–3, (B) inflammation activity from 1 to 4 points, (C) fibrosis stage from 1 to 4, (D) negative vs positive Perl’s staining. The value within the box ranges from the 25th to the 75th percentiles. The median is shown by the horizontal bar. The vertical bars represent the values between the minimum and the maximum. The * Indicates as p < 0.05 while *** as p < 0.001.

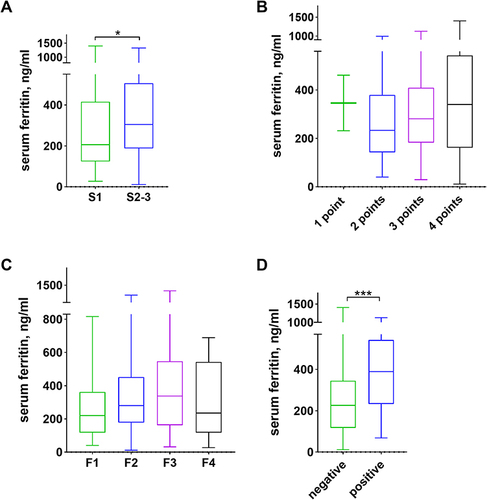
Table 3 Risk Factors of Hyperferritinemia on Univariate and Multivariable Logistic Regression Analysis