
Figures & data
Figure 1 Flow chart of the study from recruiting participants to conducting analysis.
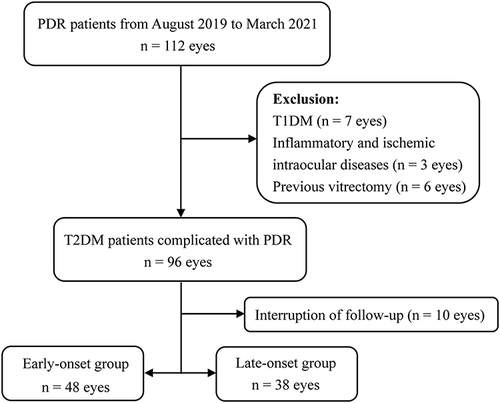
Table 1 Clinical Characteristics and Surgical Methods in the Early- and Late-Onset Groups
Figure 2 (A) Changes in BCVA in the early-onset and late-onset groups before operation and 1 months, 3 months, and 6 months after operation. (B) Postoperative complications in the two groups. *P < 0.05.
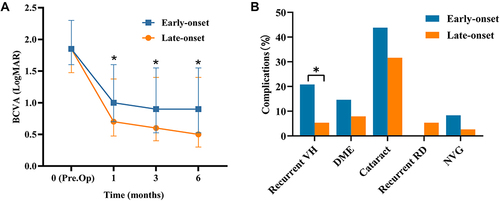
Table 2 Postoperative Complications in the Two Groups
Table 3 Vitreous Cytokine Levels in the Early- and Late-Onset Groups
Figure 3 A heatmap of correlation coefficients between cytokine concentrations and clinical characteristics. Dark blue denotes high correlation (R→1); deep red, high negative correlation (R→−1); and white, a lack of correlation (R→0). An R value of 0.3 was set as the threshold and P < 0.05 was considered significant.
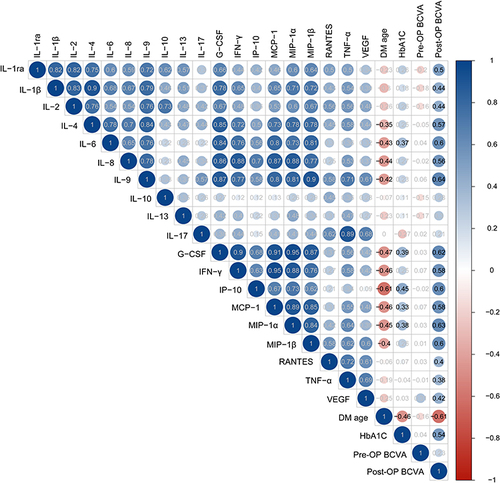
Table 4 Stepwise Multivariate Linear Regression Analysis of Risk Factors for Visual Prognosis (the BCVA at 6 Months After Operation) of PDR