418
Views
7
CrossRef citations to date
0
Altmetric
ORIGINAL RESEARCH

Relationship Between Four Non-Insulin-Based Indexes of Insulin Resistance and Serum Uric Acid in Patients with Type 2 Diabetes: A Cross-Sectional Study

, &
Pages 1461-1471 | Published online: 09 May 2022

Figures & data

Table 1 Comparisons of Clinical Characteristics of T2DM Patients with Different SUA Levels

Figure 1 Comparison of four non-insulin-based IR indexes at different serum uric acid (SUA) levels. (A) difference of triglyceride and glucose index (TyG) among the three groups; (B) difference of TyG index with body mass index (TyG-BMI) among the three groups; (C) difference of the ratio of triglycerides divided by high-density lipoprotein cholesterol (TG/HDL-c) among the three groups; (D) difference of metabolic score for insulin resistance (METS-IR) among the groups.

Figure 1 Comparison of four non-insulin-based IR indexes at different serum uric acid (SUA) levels. (A) difference of triglyceride and glucose index (TyG) among the three groups; (B) difference of TyG index with body mass index (TyG-BMI) among the three groups; (C) difference of the ratio of triglycerides divided by high-density lipoprotein cholesterol (TG/HDL-c) among the three groups; (D) difference of metabolic score for insulin resistance (METS-IR) among the groups.

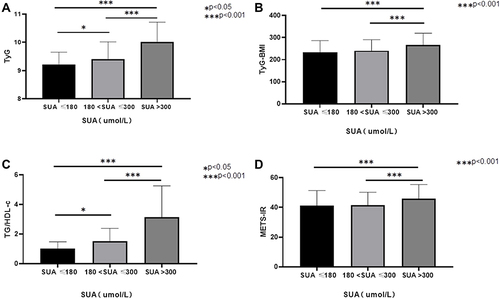
Table 2 Correlations Between SUA Level and Clinical Variables

Figure 2 Correlation between serum uric acid (SUA) and four non-insulin-based IR indexes in T2DM. (A) correlation between SUA and triglyceride and glucose index (TyG); (B) correlation between SUA and TyG index with body mass index (TyG-BMI); (C) correlation between SUA and the ratio of triglycerides divided by high-density lipoprotein cholesterol (TG/HDL-c); (D) correlation between SUA and metabolic score for insulin resistance (METS-IR).

Figure 2 Correlation between serum uric acid (SUA) and four non-insulin-based IR indexes in T2DM. (A) correlation between SUA and triglyceride and glucose index (TyG); (B) correlation between SUA and TyG index with body mass index (TyG-BMI); (C) correlation between SUA and the ratio of triglycerides divided by high-density lipoprotein cholesterol (TG/HDL-c); (D) correlation between SUA and metabolic score for insulin resistance (METS-IR).

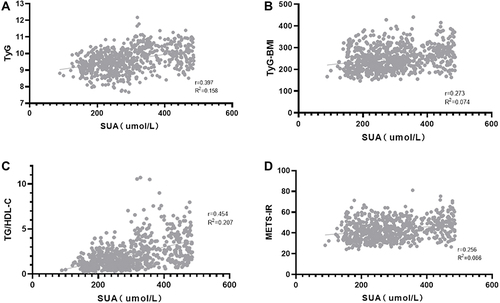
Table 3 Multiple Regression Analysis of Four Non-Insulin-Based IR Indexes Correlated with SUA in T2DM

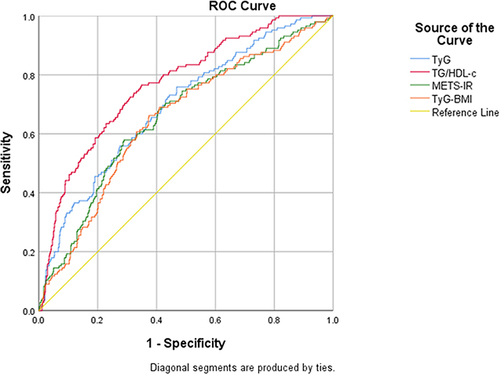
Table 4 AUCs and Cutoff Values of Four Non-Insulin-Based IR Indexes for the Prediction of HUA in T2DM

Figure 3 Receiver operating characteristic (ROC) curves for predicting HUA in T2DM.

Abbreviations: HUA, hyperuricemia; TyG, triglyceride and glucose index; TyG-BMI, TyG index with body mass index; TG/HDL-c, the ratio of triglycerides divided by high-density lipoprotein cholesterol; METS-IR, metabolic score for insulin resistance.
Figure 3 Receiver operating characteristic (ROC) curves for predicting HUA in T2DM.