Figures & data
Table 1 Patient Characteristics According to Stool Consistency
Table 2 Multiple Logistic Regression Analysis of the ImP
Figure 1 Imidazole propionate is associated with the stool consistency. (A and B) Plasma levels of imidazole propionate (ImP) in subjects with Type 2 diabetes divided according to the stool consistency. (C) Plasma levels of ImP in healthy subjects divided according to the stool consistency. **P < 0.01, ***P < 0.001.
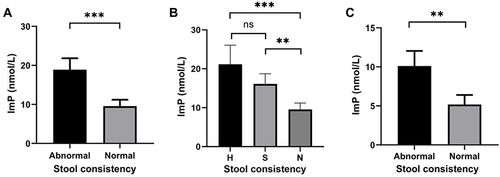
Figure 2 Imidazole propionate is associated with bile acids. (A) Imidazole propionate (ImP) level of subjects with LCA ≤ 30% was significantly higher than that of those with LCA > 30%. (B) Subjects with CDCA ≥ 5% had significantly higher ImP levels than those with CDCA < 5%. **P < 0.01.
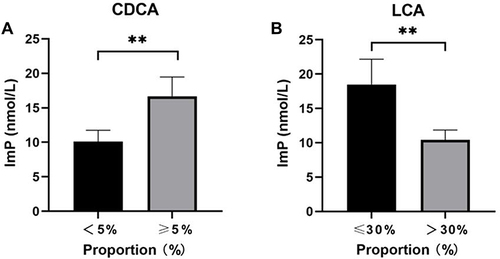
Table 3 Multiple Logistic Regression Analysis of the ImP and Bile Acids
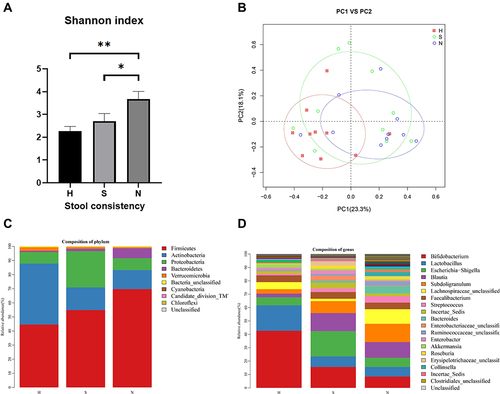
Figure 3 Classification of microbial diversity in patients with different fecal consistencies. (A) The Shannon index of group N was significantly higher than that of Group H and Group S. (B) These three groups were separated into different clusters in the UniFrac PCoA. (C and D) Bar plots of the relative abundances of the three groups at the phylum level and the genus level. *P < 0.05, **P < 0.01.