315
Views
1
CrossRef citations to date
0
Altmetric
ORIGINAL RESEARCH

Changes in the Expression of Insulin Pathway, Neutrophil Elastase and Alpha 1 Antitrypsin Genes from Leukocytes of Young Individuals with Insulin Resistance

, , , , ORCID Icon, , , ORCID Icon, , & ORCID Icon show all
Pages 1865-1876 | Published online: 18 Jun 2022

Figures & data

Table 1 Anthropometric and Biochemical Parameters by Study Group

Figure 1 Relative expression of genes of the insulin signaling pathway, NE and A1AT. Relative mRNA expression of INSR (A), IRS-1 (B), IRS-2 (C), NE (D), A1AT (E), GLUT-1 (F) and GLUT-3 (G) genes. The analysis was performed using the 2−ΔCt method and β-actin as reference gene. The p value was calculated using ANOVA and Tukey’s tests.

Figure 1 Relative expression of genes of the insulin signaling pathway, NE and A1AT. Relative mRNA expression of INSR (A), IRS-1 (B), IRS-2 (C), NE (D), A1AT (E), GLUT-1 (F) and GLUT-3 (G) genes. The analysis was performed using the 2−ΔCt method and β-actin as reference gene. The p value was calculated using ANOVA and Tukey’s tests.

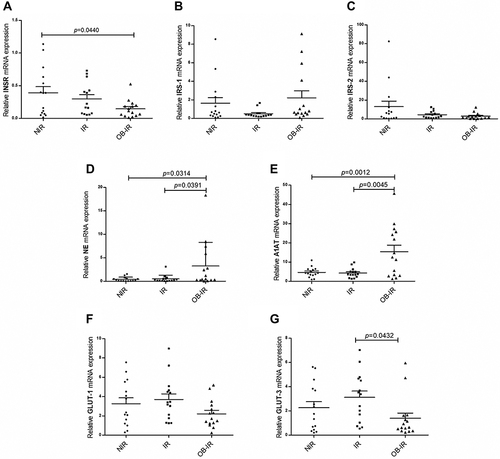
Table 2 Correlations Between the Expression of Insulin Signaling Pathway, NE and A1AT Genes

Table 3 Correlation Between NE and A1AT Gene Expression Among Anthropometric and Metabolic Parameters