Figures & data
Table 1 Baseline Characteristics of the Study Participants by Gender. P-values are Obtained from Independent Sample t-test in Comparison Between the Gender Groups
Table 2 Baseline Characteristics of the Study Participants According to UA Tertile. Values are Presented as Mean ± SE. P-values are Obtained from One-Way ANOVA
Table 3 Prevalence of Hypertension. Blood Pressure (mmHg) Was Categorized as Normal (SBP < 140; DBP < 90) and Hypertensive (SBP ≥ 140; DBP ≥ 90)
Table 4 Association of UA Quartiles with Hypertension. The Logistic Regressions Were Applied to Evaluate the Association Between SUA Quartiles and BP-Class
Figure 1 Association of SUA levels with (A) SBP and (B) DBP. The scale in the Y-axis is not similar between the figures.
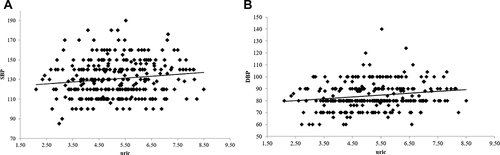
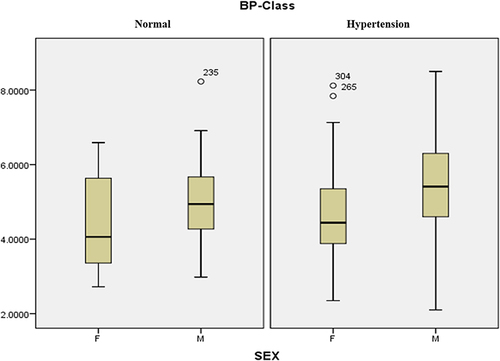
Figure 2 Box plot showing level of SUA in normal and hypertensive population by gender.